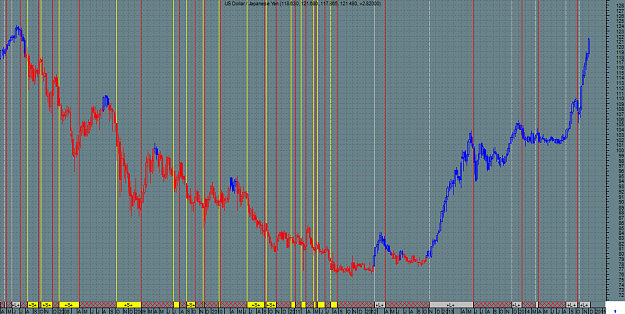
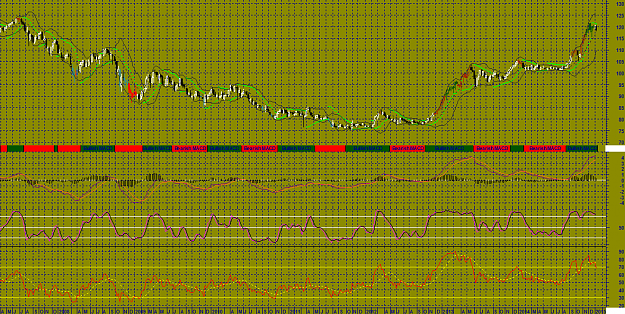
USD/JPY WEEKLY as of Monday, 08 December, 2014
PeriodStatistical Change
10-period 28.8497 0.90
21-period 22.7499 0.00
39-period 21.5087 0.57
90-period 26.1410 0.26
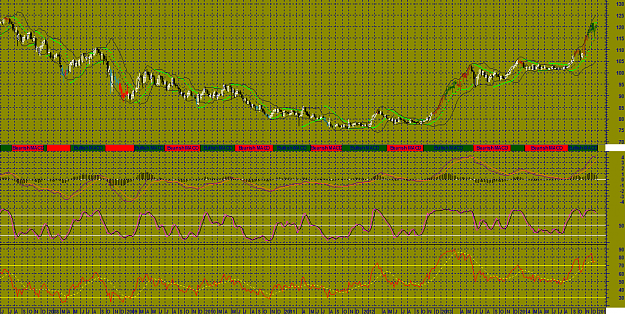
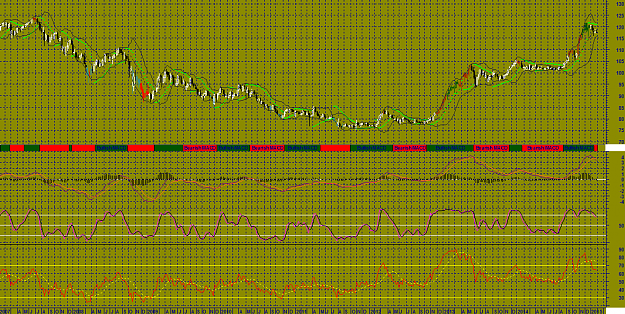
Bollinger Bands are 161.11% wider than normal. US Dollar / Japanese Yen is currently experiencing very high volatility as compared to its normal range. The probability of volatility decreasing and prices consolidating is likely in the near future.
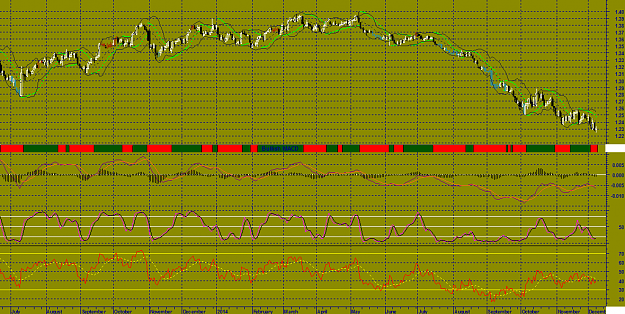
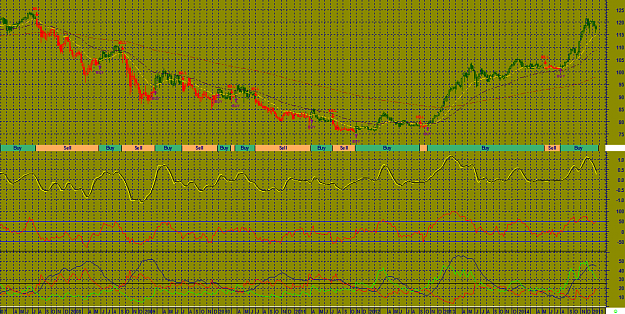
The Stochastic Oscillator is 94.9922. This is an overbought reading. Monitor for reversal signal when the Oscillator crosses below 80. The last signal was a sell 7 period(s) ago.
Relative Strength Index (RSI)
The current value of the RSI is 85.13.This is where it usually tops which often occurs before the underlying asset. The last signal was a sell 8 period(s) ago.
Commodity Channel Index (CCI)
The current value of the CCI is 143.This is an overbought reading. Monitor for reversal signal when the indicator crosses below 100. The last signal was a sell 8 period(s) ago.
MACD Momentum Indicator
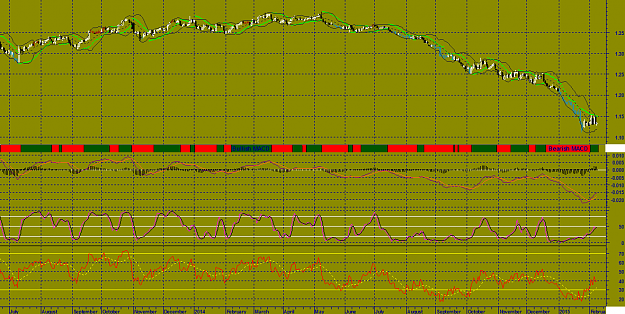
The Moving Average Convergence/Divergence INDICATOR (MACD) crosses its 9 period signal line which triggers a buy 16 period(s) ago.
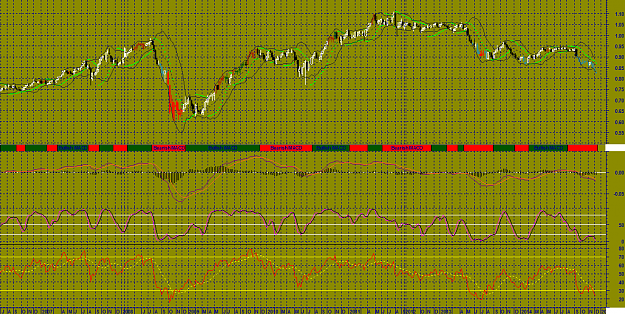
Aroon
There were no Aroon signals generated today. The last signal was a Buy 30 period(s) ago.
Directional Indicator
There were no Directional Indicator signals generated today. The last signal was a Buy 65 period(s) ago.
MACD Trend Signal
There were no MACD Trend signals generated today. The last MACD Trend signal was a Buy 53 period(s) ago.
Stop and Reverse (SAR)
There were no SAR signals generated today. The last signal was a Buy 15 period(s) ago.
Summary
The current market condition for US Dollar / Japanese Yen is: Very Bullish
The close is currently above its 200 period moving average.
The close is currently above its 90 period moving average.
The close is currently above its 30 period moving average.
If already holding long positions, we would look to partial profits on any retracement to 105.2070.
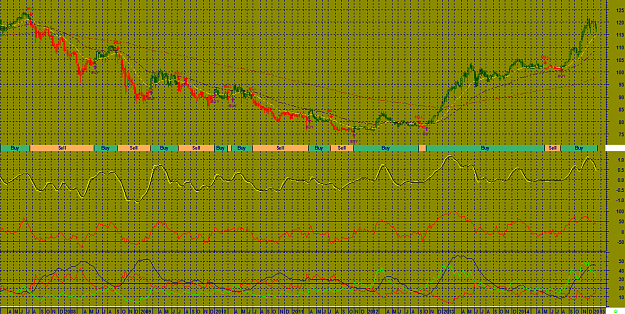
VIT Weekly Analysis
Review of US Dollar / Japanese Yen (USDJPY)
as of 05/12/14
Volatility Analysis
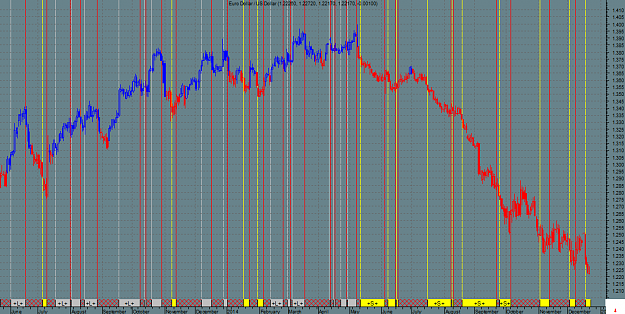
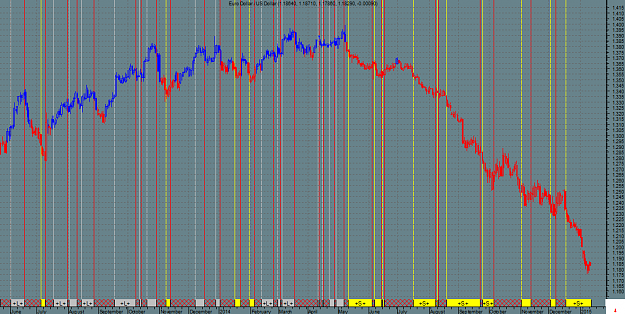
On 05/12/14, US Dollar / Japanese Yen closed up 2.8200 at 121.4800PeriodStatistical Change
10-period 28.8497 0.90
21-period 22.7499 0.00
39-period 21.5087 0.57
90-period 26.1410 0.26
Bollinger Bands are 161.11% wider than normal. US Dollar / Japanese Yen is currently experiencing very high volatility as compared to its normal range. The probability of volatility decreasing and prices consolidating is likely in the near future.
Momentum Indicators
Stochastic Oscillator
The Stochastic Oscillator is 94.9922. This is an overbought reading. Monitor for reversal signal when the Oscillator crosses below 80. The last signal was a sell 7 period(s) ago.
Relative Strength Index (RSI)
The current value of the RSI is 85.13.This is where it usually tops which often occurs before the underlying asset. The last signal was a sell 8 period(s) ago.
Commodity Channel Index (CCI)
The current value of the CCI is 143.This is an overbought reading. Monitor for reversal signal when the indicator crosses below 100. The last signal was a sell 8 period(s) ago.
MACD Momentum Indicator
The Moving Average Convergence/Divergence INDICATOR (MACD) crosses its 9 period signal line which triggers a buy 16 period(s) ago.
Trend Analysis
Aroon
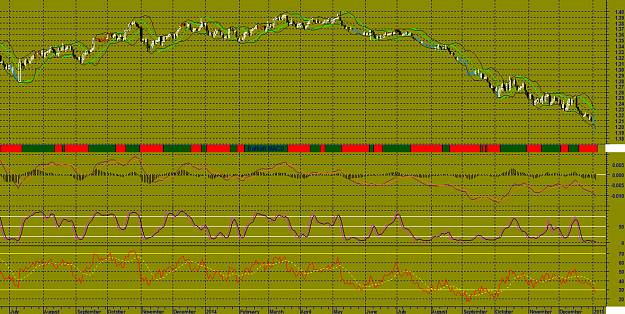
There were no Aroon signals generated today. The last signal was a Buy 30 period(s) ago.
Directional Indicator
There were no Directional Indicator signals generated today. The last signal was a Buy 65 period(s) ago.
MACD Trend Signal
There were no MACD Trend signals generated today. The last MACD Trend signal was a Buy 53 period(s) ago.
Stop and Reverse (SAR)
There were no SAR signals generated today. The last signal was a Buy 15 period(s) ago.
Summary
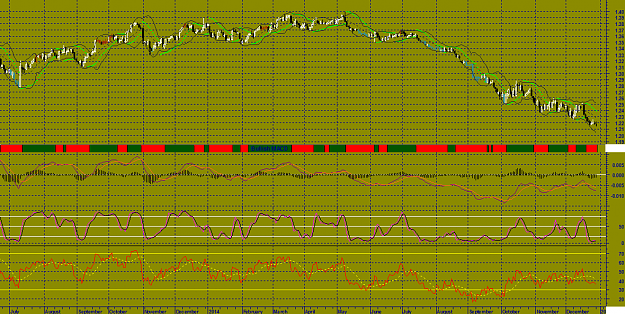
The current market condition for US Dollar / Japanese Yen is: Very Bullish
The close is currently above its 200 period moving average.
The close is currently above its 90 period moving average.
The close is currently above its 30 period moving average.
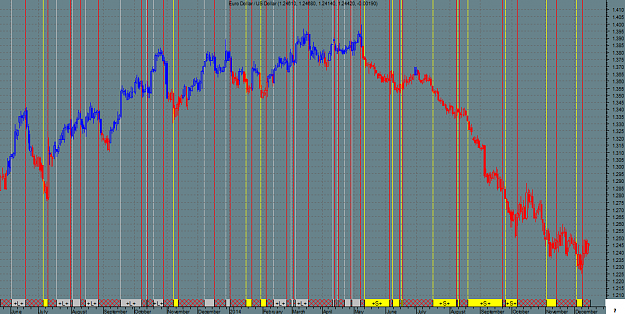
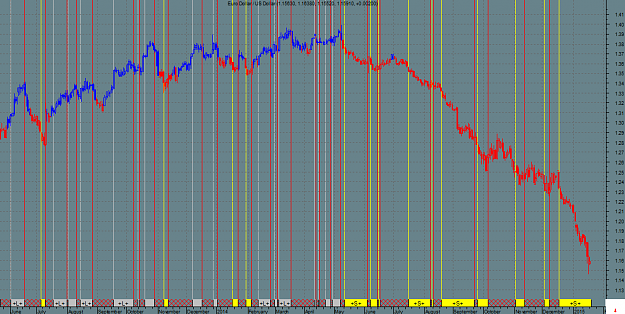
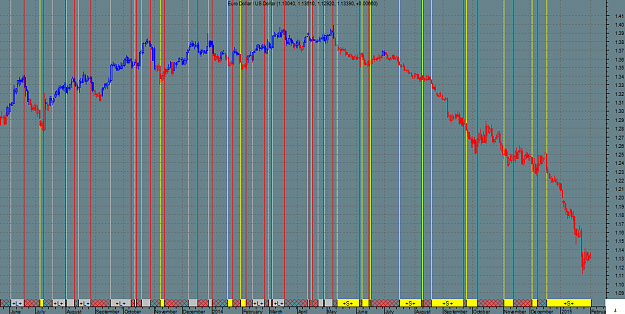
Analysis of activity through 05/12/14
close: 121.4800
The current trend is up and all orders on the long side may be considered. The current market price activity is Strongly Bullish and suggests favorable trade opportunities on the long side.If already holding long positions, we would look to partial profits on any retracement to 105.2070.
Attached Image (click to enlarge)