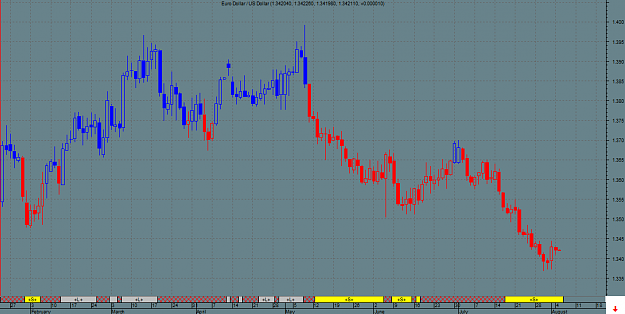
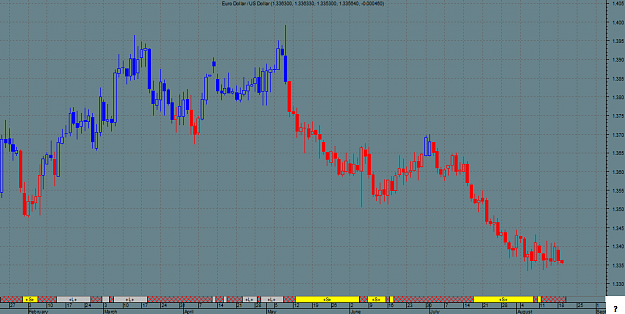
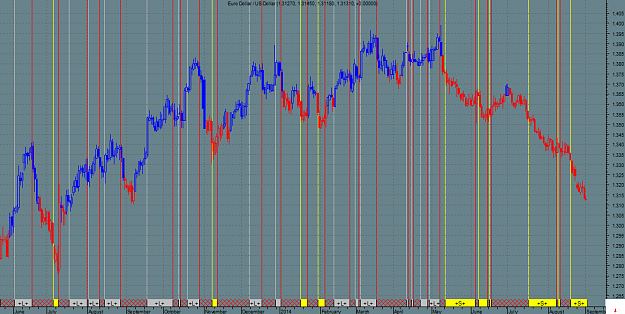
EUR/USD DAILY as of Tuesday, 22 July, 2014
Sell Target: 1.3521
Sell Stop: 1.3533
Enter New SELL on OPEN and exit SELL positions at Target price or at Stop price.
(NOTE: Adjust Stop Loss Price according to your trading risk.)
Do not reverse after exiting. This is a recommendation for INTRA-DAY TRADING only!!!!!
A white body has formed as prices closed higher than open.
The previous 10 candlestick bars, there are 5 white candles versus 5 black candles.
The previous 50 candlestick bars, there are 24 white candles versus 26 black candles with a net of 2 black candles.
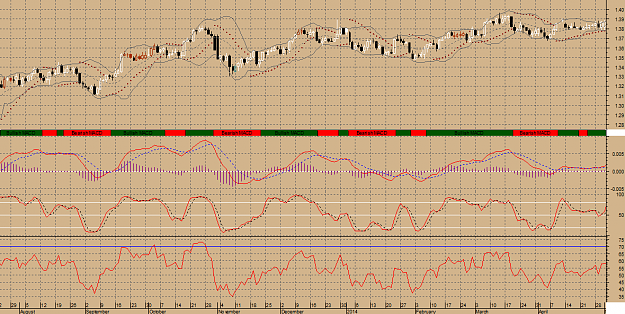
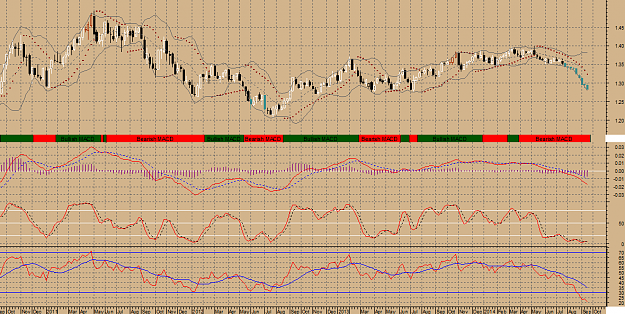
A spinning top has formed which is a candle with a small real body. Spinning tops identify a session in which there is little price action as defined by the difference between the open and the close. During a rally or near new highs, a spinning top can be a sign that prices are losing momentum and the bulls may be in trouble.MACD is BEARISH as the MACD is below the signal line.
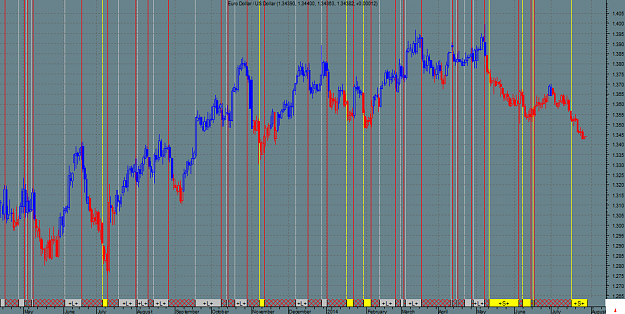
The MACD crossed below the signal line 5 period(s) ago. Since the MACD crossed the MACD moving average, Euro Dollar / US Dollar's price has decreased 0.33%, and has been fluctuating from a high of 1.363 to a low of 1.349.
The MACD is currently not in an Overbought/Oversold range.
There have been no divergence signals during the last 5 periods.
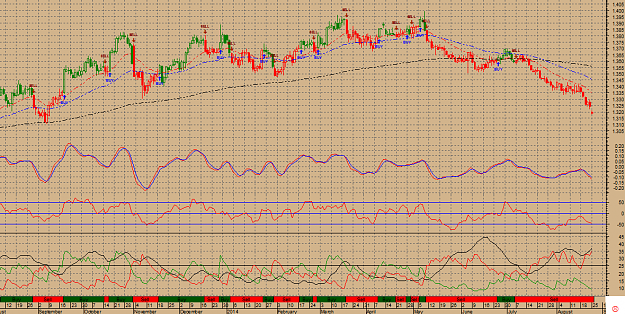
The Stochastic Oscillator is currently below 20. This is an indication of the security being in an "oversold" condition. No Stochastic Buy or Sell signals generated today. The last signal was a Sell 13 Period(s) Ago.
The RSI is not currently in a topping (above 70) or bottoming (below 30) range. A buy or sell signal generated when the RSI moves out of an overbought/oversold area. The last signal was a Buy 38 period(s) ago.
Currently the RSI does not show any Failure Swings. The RSI and price of Euro Dollar / US Dollar are not diverging.
Currently, the Momentum Oscillator does not show an overbought or oversold condition.
The last Directional Movement Indicators (DMI) signal was a SELL 13 period(s) ago.
There were no SAR signals generated today. The last SAR signal was a Sell 5 period(s) ago.
The close is currently
BELOW its 200 daily moving average
BELOW its 50 daily moving average
BELOW its 20 daily moving average
The current market condition for Euro Dollar / US Dollar is Very Bearish
Euro Dollar / US Dollar closed above the lower Bollinger Band by 14.3%. Bollinger Bands are 24.54% narrower than normal. The current width of the Bollinger Bands (alone) does not suggest anything conclusive about the future volatility or movement of prices.
Elliott Waves High Volatility has detected a possible point 4 of a WolfWave (21%) pattern for Euro Dollar / US Dollar. This pattern is an expanding triangle and trades from the next point. When the peak or trough will form, usually after crossing or touching the extended line of points 1 and 3, the price will move in the opposite direction towards the target line formed by the extension of points 2 and 4.
An Inside Day Narrow Range was detected by your Elliott Waves High Volatility on 22/07/14. This is usually a trade set-up opportunity.
Elliott Waves High Volatility has detected an Isolated High at 1.35 one bar ago; this is usually a bearish sign that is not to be used alone!
The present wave patterns are:
fast amplitude (8%): bullish wave 1
moderate amplitude (13%): bullish wave 3
Euro Dollar / US Dollar is long term Bearish as the 144 days moving average of 1.36 is decreasing. The Relative Strength Index is at 38.11 in the neutral territory. The Relative Momentum Index is at 26.73 in the oversold territory. An important indicator for Elliott waves, the Elliott oscillator is at -0.01, in negative territory; this is a bearish sign. An equally important indicator, the STORSI is at 11.89. This value is in the oversold territory.
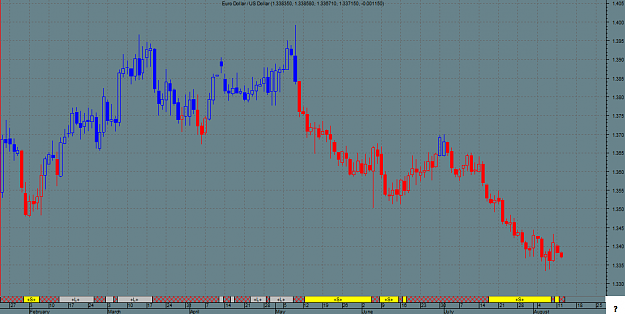
Euro Dollar / US Dollar-EURUSD
*** Intra-Daily Trading Strategy: SELL Euro Dollar / US DollarSell Target: 1.3521
Sell Stop: 1.3533
Enter New SELL on OPEN and exit SELL positions at Target price or at Stop price.
(NOTE: Adjust Stop Loss Price according to your trading risk.)
Do not reverse after exiting. This is a recommendation for INTRA-DAY TRADING only!!!!!
A white body has formed as prices closed higher than open.
The previous 10 candlestick bars, there are 5 white candles versus 5 black candles.
The previous 50 candlestick bars, there are 24 white candles versus 26 black candles with a net of 2 black candles.
A spinning top has formed which is a candle with a small real body. Spinning tops identify a session in which there is little price action as defined by the difference between the open and the close. During a rally or near new highs, a spinning top can be a sign that prices are losing momentum and the bulls may be in trouble.MACD is BEARISH as the MACD is below the signal line.
The MACD crossed below the signal line 5 period(s) ago. Since the MACD crossed the MACD moving average, Euro Dollar / US Dollar's price has decreased 0.33%, and has been fluctuating from a high of 1.363 to a low of 1.349.
The MACD is currently not in an Overbought/Oversold range.
There have been no divergence signals during the last 5 periods.
The Stochastic Oscillator is currently below 20. This is an indication of the security being in an "oversold" condition. No Stochastic Buy or Sell signals generated today. The last signal was a Sell 13 Period(s) Ago.
The RSI is not currently in a topping (above 70) or bottoming (below 30) range. A buy or sell signal generated when the RSI moves out of an overbought/oversold area. The last signal was a Buy 38 period(s) ago.
Currently the RSI does not show any Failure Swings. The RSI and price of Euro Dollar / US Dollar are not diverging.
Currently, the Momentum Oscillator does not show an overbought or oversold condition.
The last Directional Movement Indicators (DMI) signal was a SELL 13 period(s) ago.
There were no SAR signals generated today. The last SAR signal was a Sell 5 period(s) ago.
The close is currently
BELOW its 200 daily moving average
BELOW its 50 daily moving average
BELOW its 20 daily moving average
The current market condition for Euro Dollar / US Dollar is Very Bearish
Euro Dollar / US Dollar closed above the lower Bollinger Band by 14.3%. Bollinger Bands are 24.54% narrower than normal. The current width of the Bollinger Bands (alone) does not suggest anything conclusive about the future volatility or movement of prices.
Elliott Waves High Volatility has detected a possible point 4 of a WolfWave (21%) pattern for Euro Dollar / US Dollar. This pattern is an expanding triangle and trades from the next point. When the peak or trough will form, usually after crossing or touching the extended line of points 1 and 3, the price will move in the opposite direction towards the target line formed by the extension of points 2 and 4.
An Inside Day Narrow Range was detected by your Elliott Waves High Volatility on 22/07/14. This is usually a trade set-up opportunity.
Elliott Waves High Volatility has detected an Isolated High at 1.35 one bar ago; this is usually a bearish sign that is not to be used alone!
The present wave patterns are:
fast amplitude (8%): bullish wave 1
moderate amplitude (13%): bullish wave 3
Euro Dollar / US Dollar is long term Bearish as the 144 days moving average of 1.36 is decreasing. The Relative Strength Index is at 38.11 in the neutral territory. The Relative Momentum Index is at 26.73 in the oversold territory. An important indicator for Elliott waves, the Elliott oscillator is at -0.01, in negative territory; this is a bearish sign. An equally important indicator, the STORSI is at 11.89. This value is in the oversold territory.
Attached Image (click to enlarge)