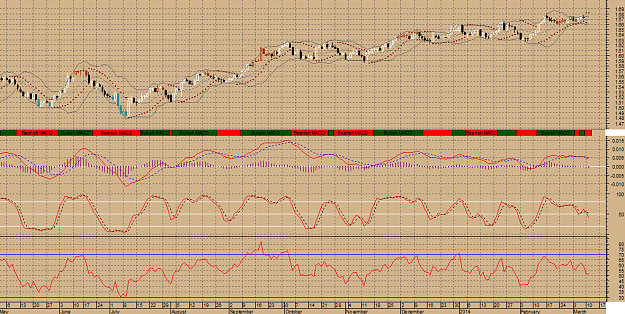
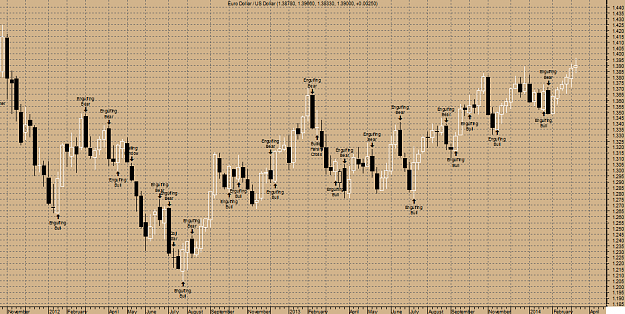
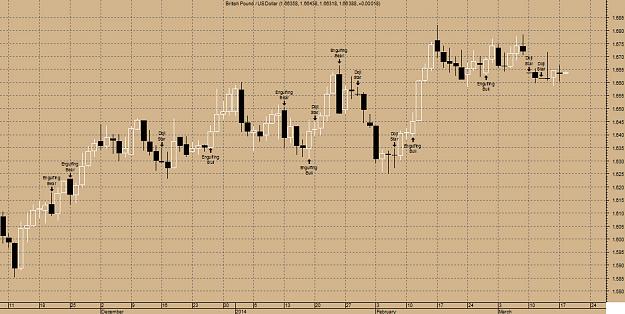
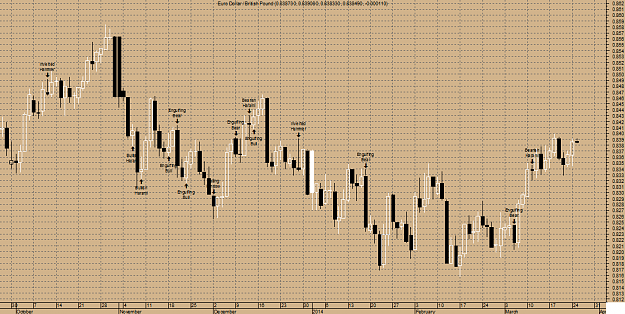
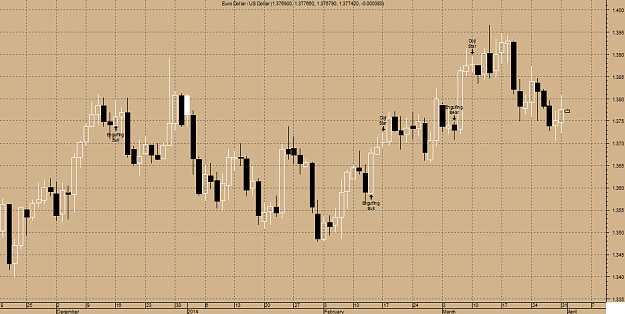
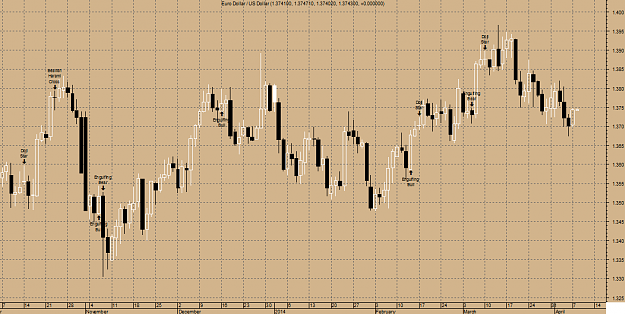
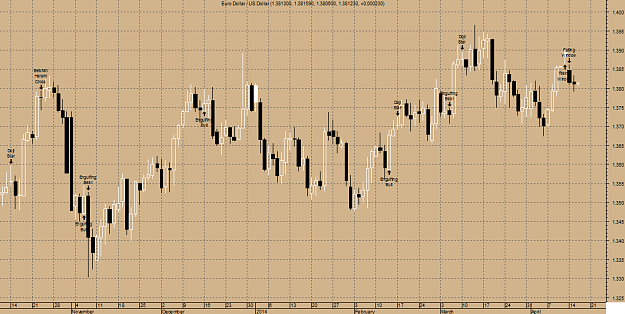
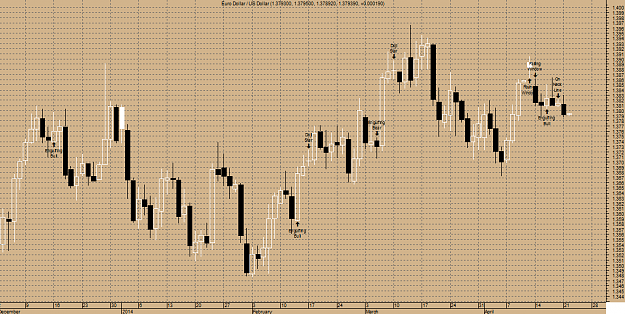
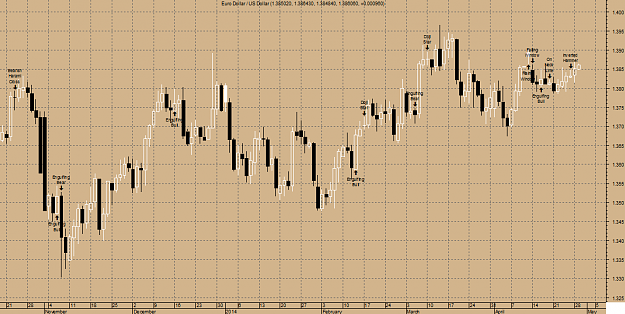
EUR/USD WEEKLY as of Monday, 03 March, 2014
A black body has formed as prices closed lower than open.
The previous 10 candlestick bars, there are 6 white candles versus 4 black candles with a net of 2 white candles.
The previous 50 candlestick bars, there are 29 white candles versus 21 black candles with a net of 8 white candles.
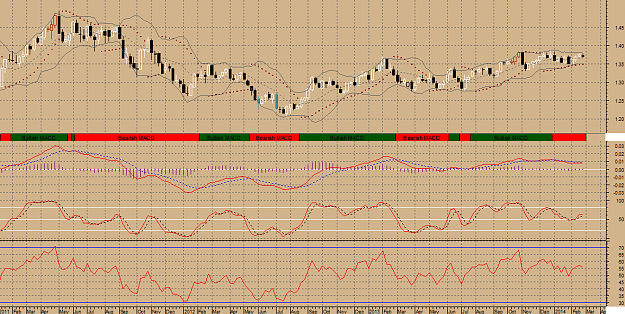
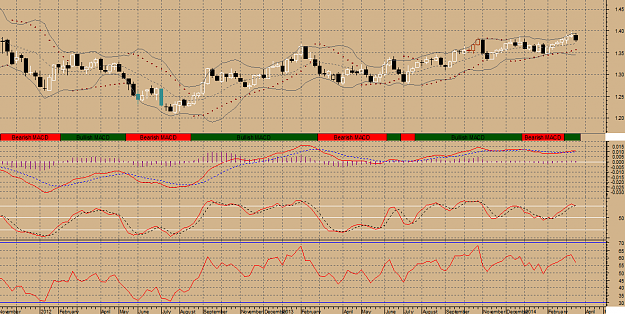
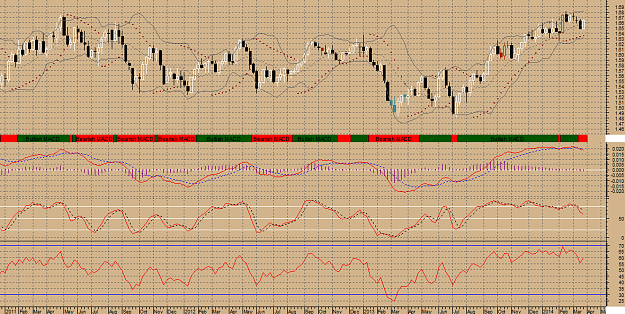
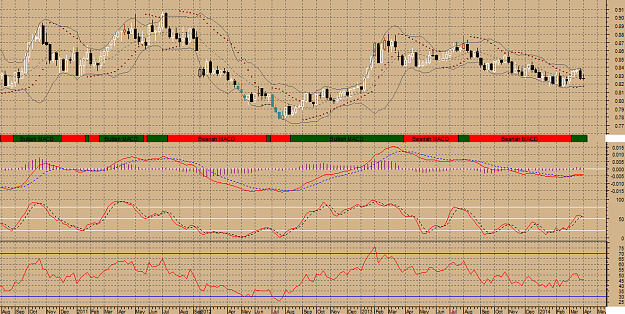
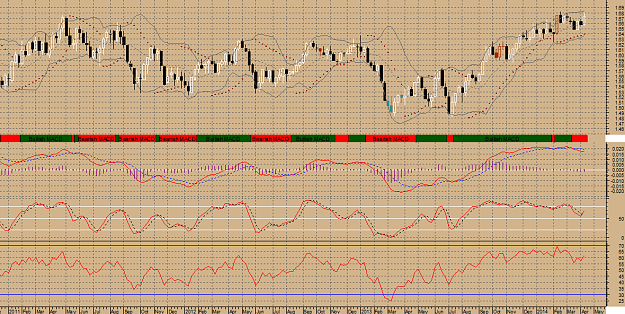
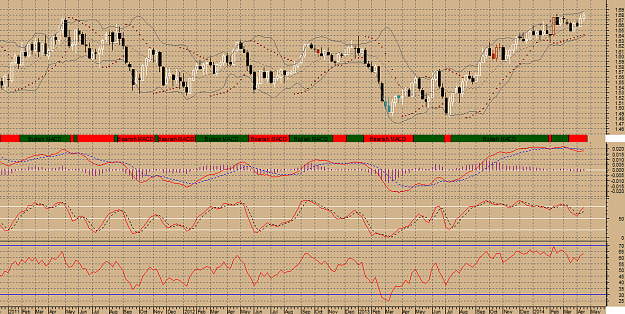
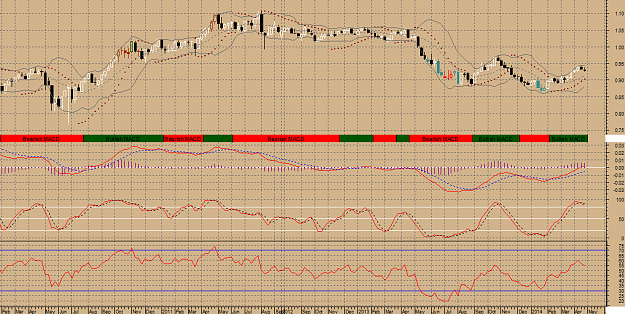
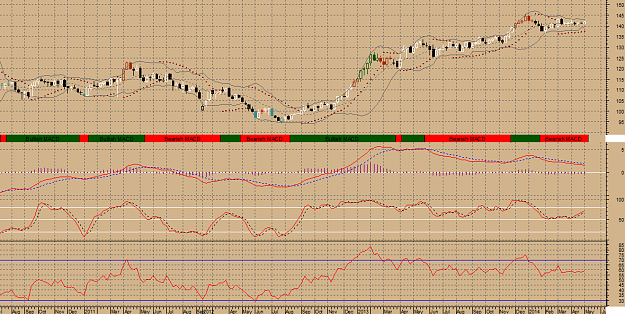
MACD is BEARISH as the MACD is below the signal line. The MACD crossed below the signal line 8 period(s) ago. Since the MACD crossed the MACD moving average, Euro Dollar / US Dollar's price has increased 0.85%, and has been fluctuating from a high of 1.382 to a low of 1.348. The MACD is currently not in an Overbought/Oversold range.
Directional Movement Indicators (DMI) currently is not indicating a specific price direction.
SAR signal was a Buy 11 period(s) Ago.
The close is currently
ABOVE its 200 weekly moving average
ABOVE its 50 weekly moving average
ABOVE its 20 weekly moving average
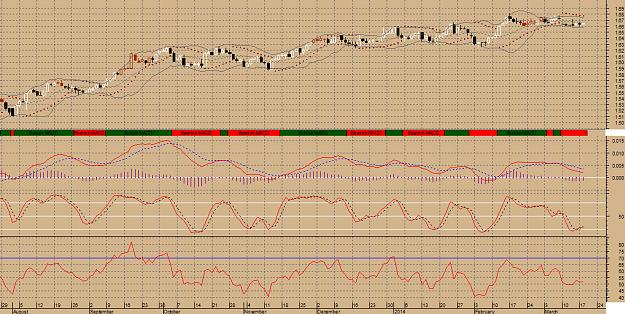
The current market condition for Euro Dollar / US Dollar is Very Bullish
Euro Dollar / US Dollar closed below the upper Bollinger Band by 32.9%. Bollinger Bands are 64.38% narrower than normal. The narrow width of the Bollinger Bands suggests low volatility as compared to Euro Dollar / US Dollar's normal range. Therefore, the probability of volatility increasing with a sharp price move has increased for the near-term. The Bollinger Bands have been in this narrow range for 14 period(s). The probability of a significant price move increases the longer the Bollinger Bands remain in this narrow range.
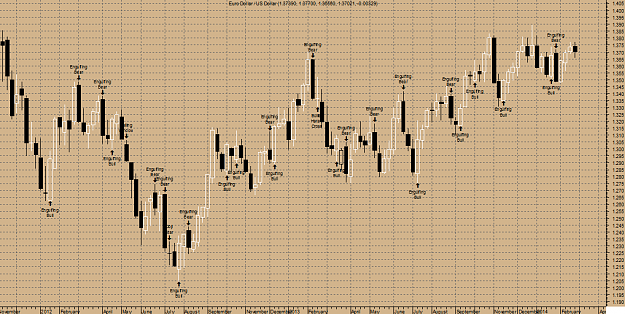
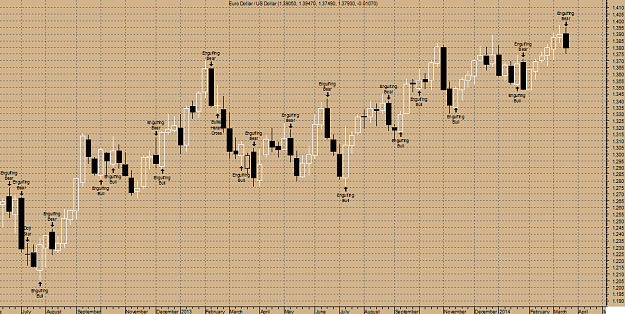
Elliott Waves High Volatility has detected a possible point 4 of a WolfWave (21%) pattern for Euro Dollar / US Dollar. This pattern is an expanding triangle and trades from the next point. When the peak or trough will form, usually after crossing or touching the extended line of points 1 and 3, the price will move in the opposite direction towards the target line formed by the extension of points 2 and 4.
Elliott Waves High Volatility has detected an Isolated High at 1.38 one bar ago; this is usually a bearish sign that is not to be used alone!
The present wave patterns are:
fast amplitude (8%): bullish wave 1
moderate amplitude (13%): bullish wave 3
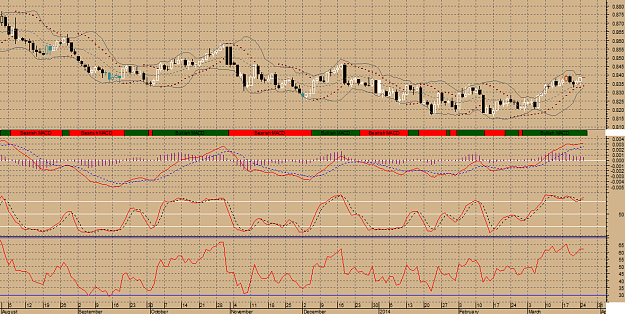
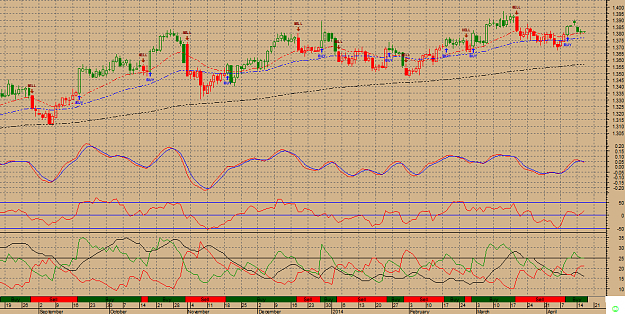
Euro Dollar / US Dollar is long term Bullish as the 144 days moving average of 1.33 is increasing. The Relative Strength Index is at 55.74 in the neutral territory. The Relative Momentum Index is at 65.20 in the neutral territory. An important indicator for Elliott waves, the Elliott oscillator is at 0.02, in positive territory; this is a bullish sign. An equally important indicator, the STORSI is at 59.59. This value is in the neutral territory.
Overall, the bias in prices is: Upwards.
Short term: Prices are stalling.
Intermediate term: Prices are ranging.
A black body has formed as prices closed lower than open.
The previous 10 candlestick bars, there are 6 white candles versus 4 black candles with a net of 2 white candles.
The previous 50 candlestick bars, there are 29 white candles versus 21 black candles with a net of 8 white candles.
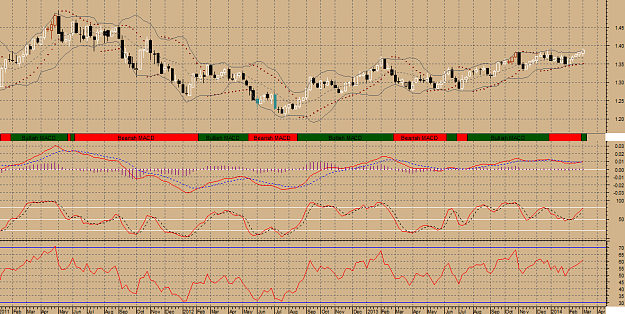
MACD is BEARISH as the MACD is below the signal line. The MACD crossed below the signal line 8 period(s) ago. Since the MACD crossed the MACD moving average, Euro Dollar / US Dollar's price has increased 0.85%, and has been fluctuating from a high of 1.382 to a low of 1.348. The MACD is currently not in an Overbought/Oversold range.
Directional Movement Indicators (DMI) currently is not indicating a specific price direction.
SAR signal was a Buy 11 period(s) Ago.
The close is currently
ABOVE its 200 weekly moving average
ABOVE its 50 weekly moving average
ABOVE its 20 weekly moving average
The current market condition for Euro Dollar / US Dollar is Very Bullish
Euro Dollar / US Dollar closed below the upper Bollinger Band by 32.9%. Bollinger Bands are 64.38% narrower than normal. The narrow width of the Bollinger Bands suggests low volatility as compared to Euro Dollar / US Dollar's normal range. Therefore, the probability of volatility increasing with a sharp price move has increased for the near-term. The Bollinger Bands have been in this narrow range for 14 period(s). The probability of a significant price move increases the longer the Bollinger Bands remain in this narrow range.
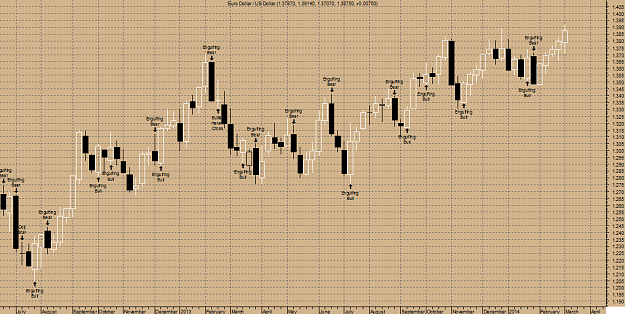
Elliott Waves High Volatility has detected a possible point 4 of a WolfWave (21%) pattern for Euro Dollar / US Dollar. This pattern is an expanding triangle and trades from the next point. When the peak or trough will form, usually after crossing or touching the extended line of points 1 and 3, the price will move in the opposite direction towards the target line formed by the extension of points 2 and 4.
Elliott Waves High Volatility has detected an Isolated High at 1.38 one bar ago; this is usually a bearish sign that is not to be used alone!
The present wave patterns are:
fast amplitude (8%): bullish wave 1
moderate amplitude (13%): bullish wave 3
Euro Dollar / US Dollar is long term Bullish as the 144 days moving average of 1.33 is increasing. The Relative Strength Index is at 55.74 in the neutral territory. The Relative Momentum Index is at 65.20 in the neutral territory. An important indicator for Elliott waves, the Elliott oscillator is at 0.02, in positive territory; this is a bullish sign. An equally important indicator, the STORSI is at 59.59. This value is in the neutral territory.
Overall, the bias in prices is: Upwards.
Short term: Prices are stalling.
Intermediate term: Prices are ranging.
Attached Image(s) (click to enlarge)