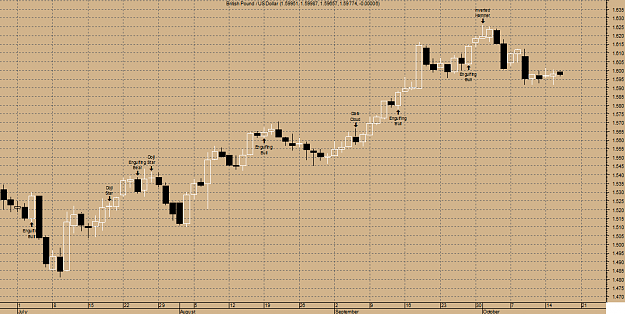
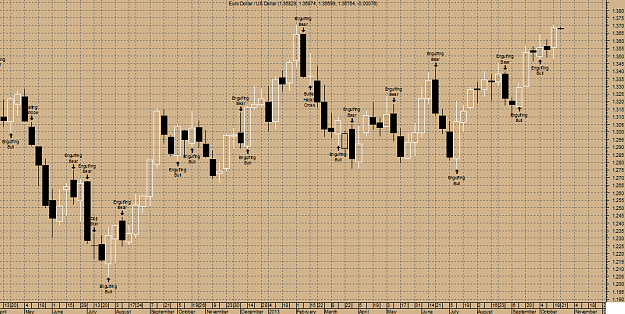
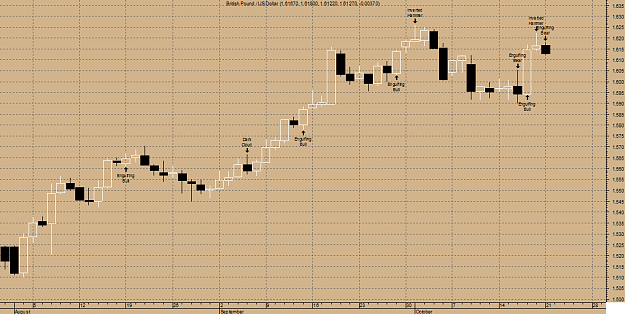
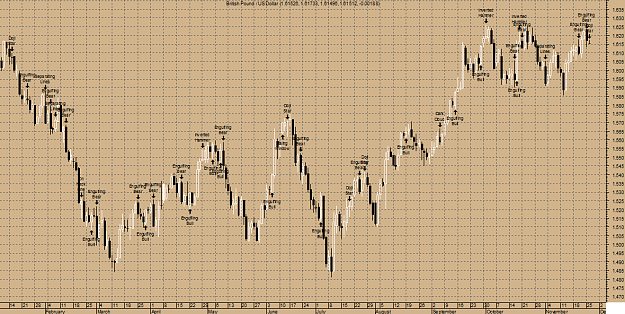
GBP/USD DAILY as of Wednesday, 16 October, 2013
*** Intra-Daily Trading Strategy:SELLBritish Pound / US Dollar
Sell Target: 1.5963
Sell Stop: 1.6014
Enter New SELL on OPEN and exit SELL positions at Target price or at Stop price.
(NOTE: Adjust Stop Loss Price according to your trading risk.)
Do not reverseafter exiting. This is a recommendation for INTRA-DAY TRADING only!!!!!
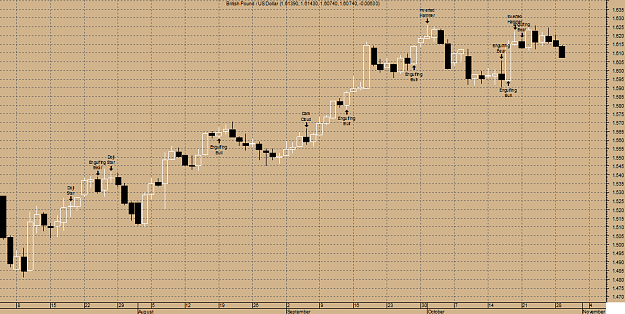
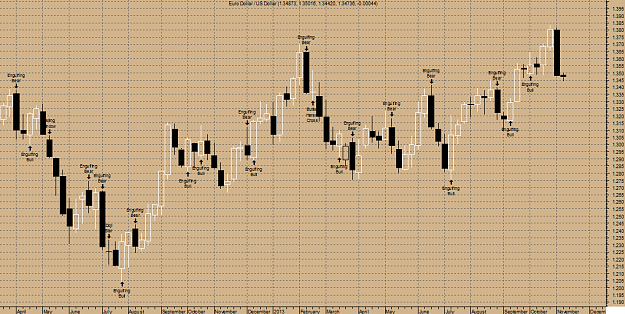
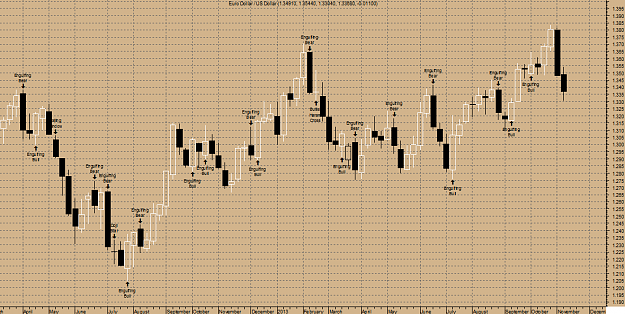
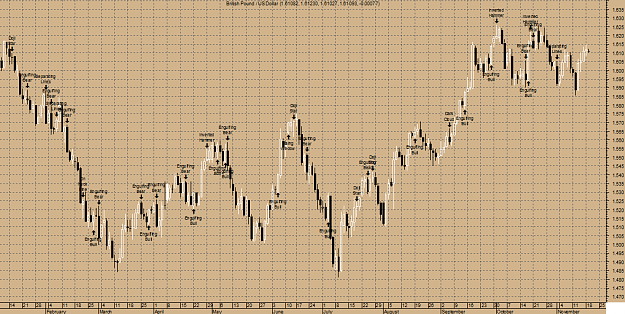
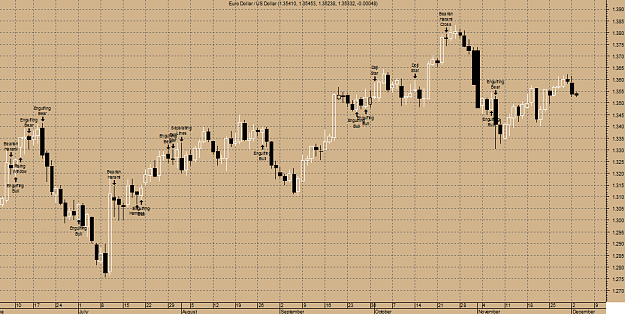
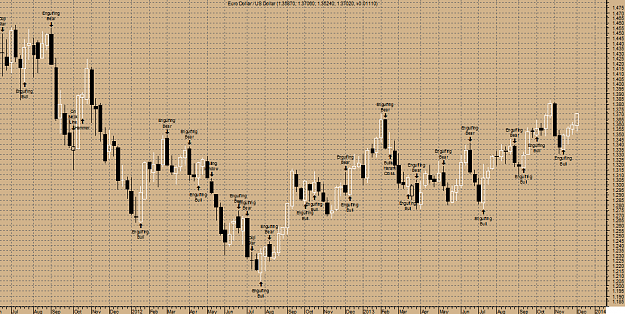
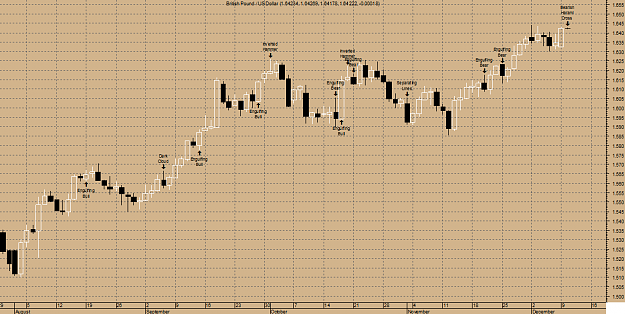
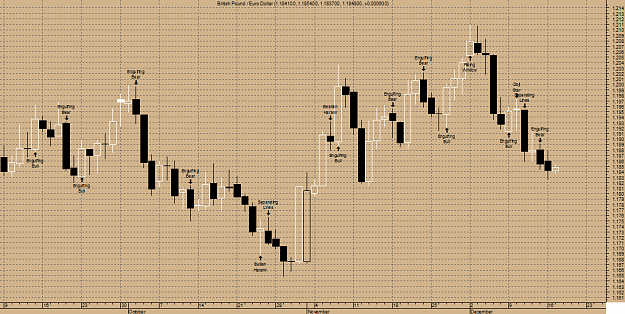
A black body has formed as prices closed lower than open.
The previous 10 candlestick bars, there are 5 white candles versus 5 black candles.
The previous 50 candlestick bars, there are 29 white candles versus 21 black candles with a net of 8 white candles.
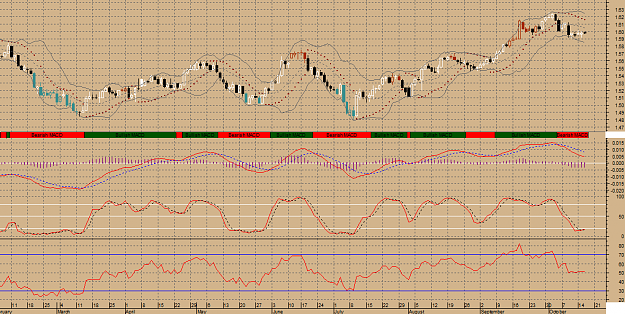
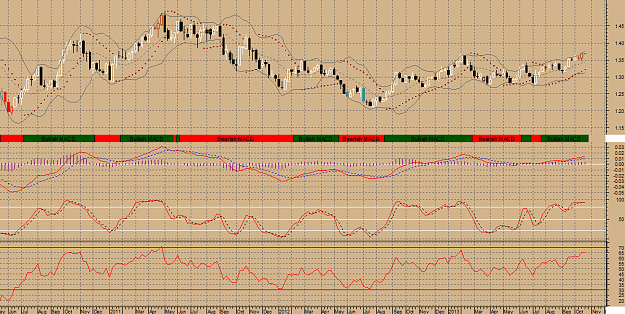
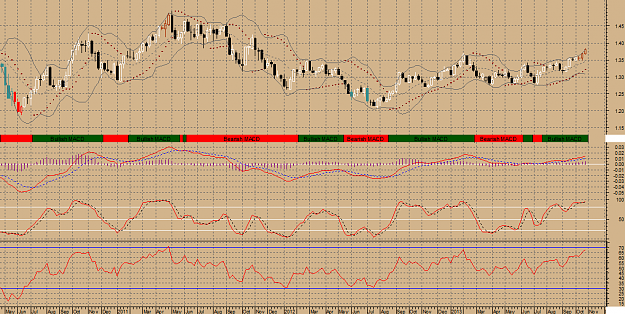
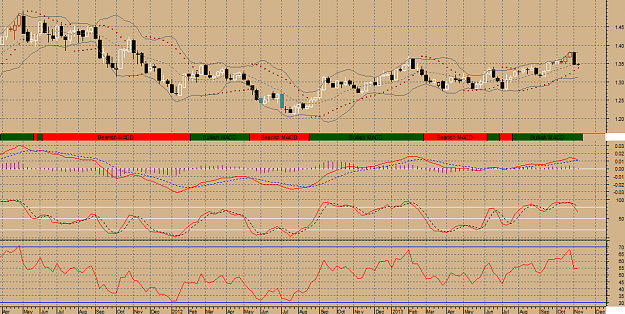
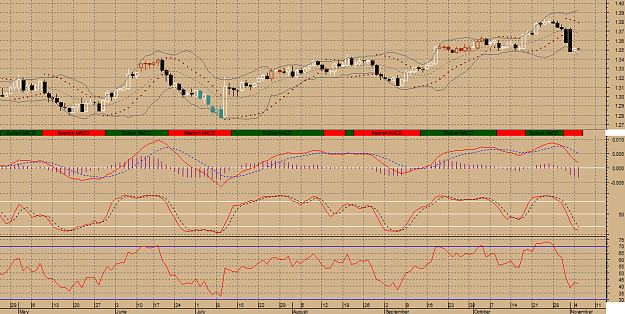
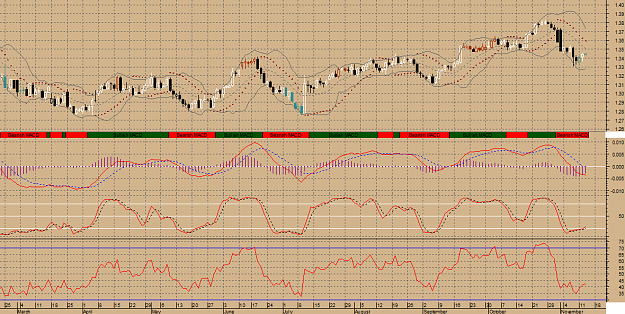
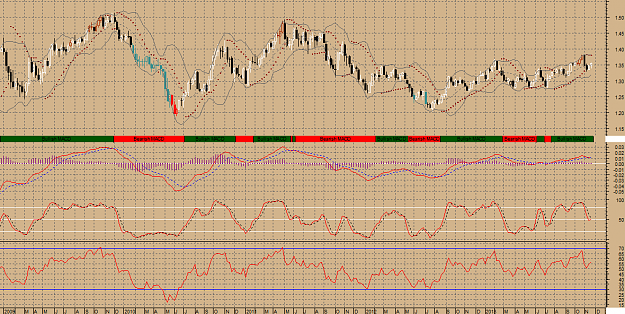
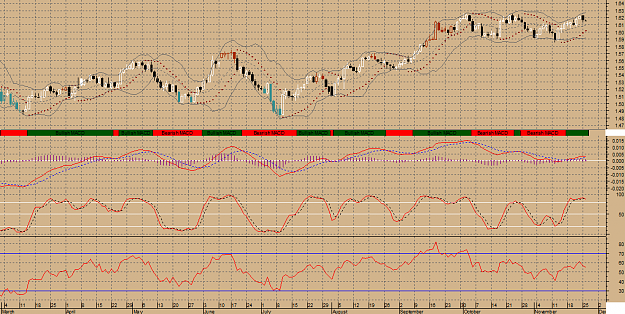
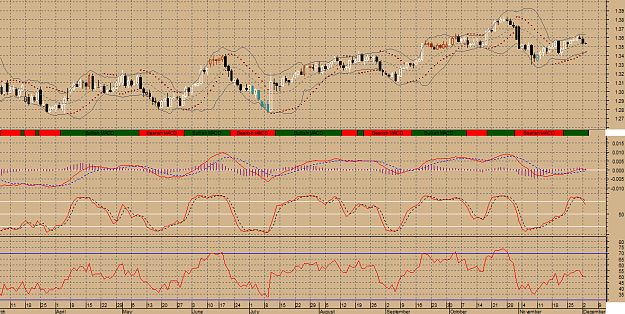
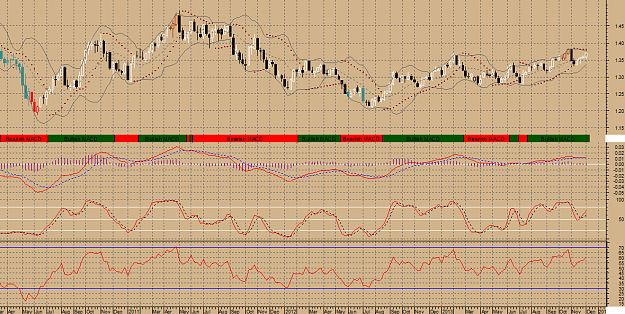
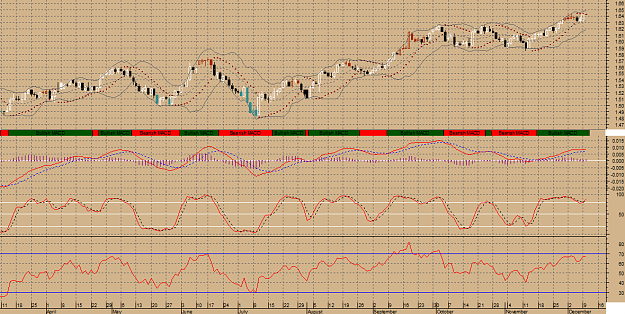
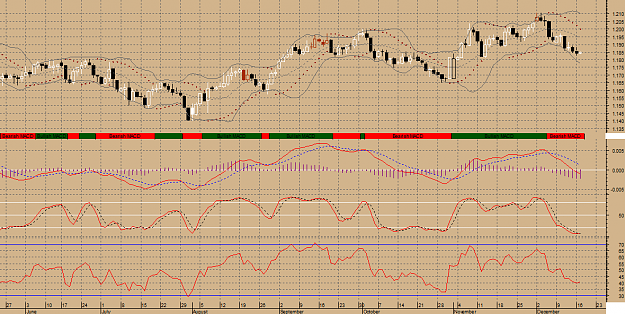
MACD is BEARISH as the MACD is below the signal line. The MACD crossed below the signal line 8 period(s) ago. Since the MACD crossed the MACD moving average, British Pound / US Dollar's price has decreased0.20%, and has been fluctuating from a high of 1.618 to a low of 1.591.
The Stochastic Oscillator is currently below 20 indicating an "oversold" condition.
RSI was a Sell 9 period(s) ago.
SAR signal was a Sell8 period(s) ago.
The close is currently
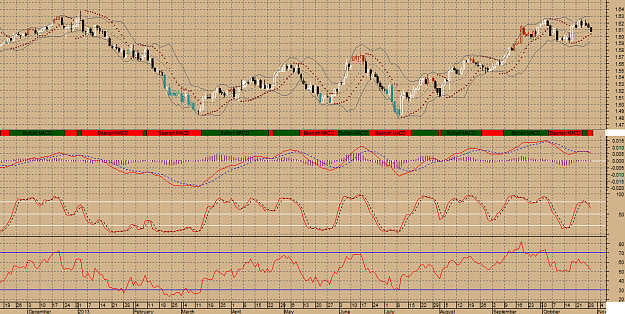
ABOVE its 200 daily moving average
ABOVE its 50 daily moving average
BELOW its 20 daily moving average
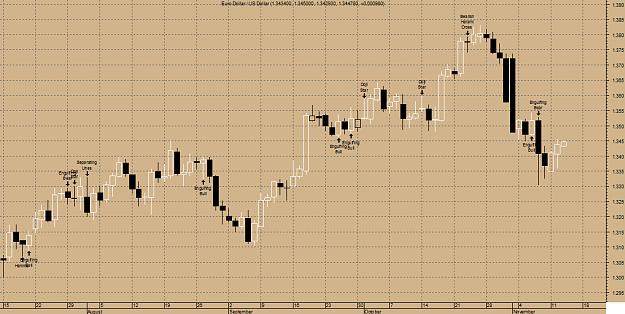
The current market condition for British Pound / US Dollar is Bullish.British Pound / US Dollar broke below the up trendline at 1.60, 5 day(s) ago. This is a bearish sign. This up trendline, currently with an ending point at 1.61, now provide upside resistance. Prices having only declined 0.15% since the breakout.
British Pound / US Dollar closed above the lower Bollinger Band by 27.3%. Bollinger Bands are 39.67% narrower than normal. The current width of the Bollinger Bands (alone) does not suggest anything conclusive about the future volatility or movement of prices.
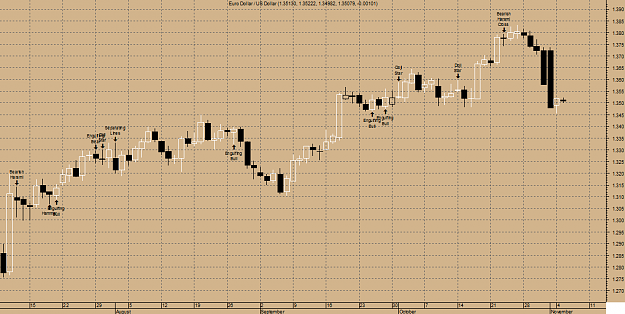
An Inside Day Narrow Range was detected by your Elliott Waves High Volatility on 16/10/13. This is usually a trade set-up opportunity.
Elliott Waves High Volatility has detected an Isolated Low at 1.59 one bar ago; this is usually a bullish sign that is not to be used alone!
The present wave patterns are:
*** Intra-Daily Trading Strategy:SELLBritish Pound / US Dollar
Sell Target: 1.5963
Sell Stop: 1.6014
Enter New SELL on OPEN and exit SELL positions at Target price or at Stop price.
(NOTE: Adjust Stop Loss Price according to your trading risk.)
Do not reverseafter exiting. This is a recommendation for INTRA-DAY TRADING only!!!!!
A black body has formed as prices closed lower than open.
The previous 10 candlestick bars, there are 5 white candles versus 5 black candles.
The previous 50 candlestick bars, there are 29 white candles versus 21 black candles with a net of 8 white candles.
MACD is BEARISH as the MACD is below the signal line. The MACD crossed below the signal line 8 period(s) ago. Since the MACD crossed the MACD moving average, British Pound / US Dollar's price has decreased0.20%, and has been fluctuating from a high of 1.618 to a low of 1.591.
The Stochastic Oscillator is currently below 20 indicating an "oversold" condition.
RSI was a Sell 9 period(s) ago.
SAR signal was a Sell8 period(s) ago.
The close is currently
ABOVE its 200 daily moving average
ABOVE its 50 daily moving average
BELOW its 20 daily moving average
The current market condition for British Pound / US Dollar is Bullish.British Pound / US Dollar broke below the up trendline at 1.60, 5 day(s) ago. This is a bearish sign. This up trendline, currently with an ending point at 1.61, now provide upside resistance. Prices having only declined 0.15% since the breakout.
British Pound / US Dollar closed above the lower Bollinger Band by 27.3%. Bollinger Bands are 39.67% narrower than normal. The current width of the Bollinger Bands (alone) does not suggest anything conclusive about the future volatility or movement of prices.
An Inside Day Narrow Range was detected by your Elliott Waves High Volatility on 16/10/13. This is usually a trade set-up opportunity.
Elliott Waves High Volatility has detected an Isolated Low at 1.59 one bar ago; this is usually a bullish sign that is not to be used alone!
The present wave patterns are:
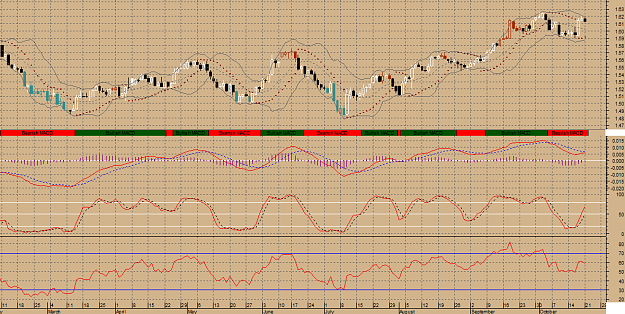
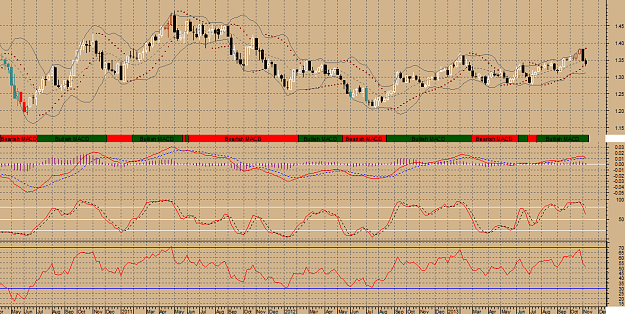
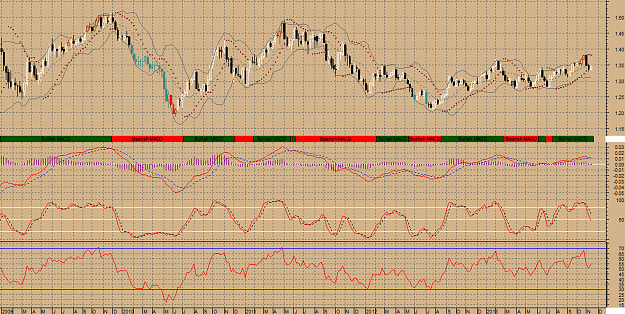
fast amplitude (8%): bullish wave 3
British Pound / US Dollar is long term Bullish as the 144 days moving average of 1.56 is increasing. The Relative Strength Index is at 51.46 in the neutral territory. The Relative Momentum Index is at 58.91 in the neutral territory. An important indicator for Elliott waves, the Elliott oscillator is at 0.01, in positive territory; this is a bullish sign. An equally important indicator, the STORSI is at 8.37. This value is in the oversoldterritory.Attached Image(s) (click to enlarge)