thanks for the vouch!
I enjoy reading your informative, no-nonsense approach to trading.
------------------
Using simulator to run trades, demo still too inconsistent.
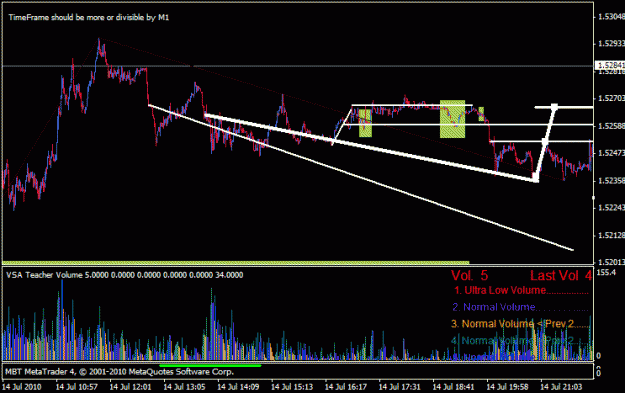
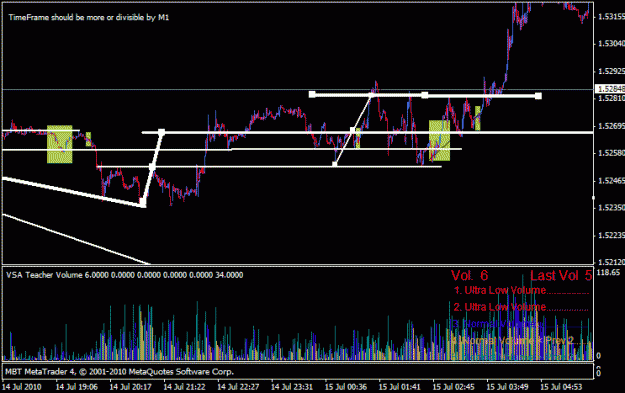
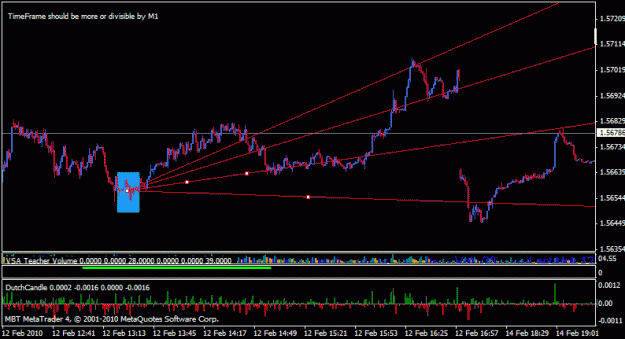
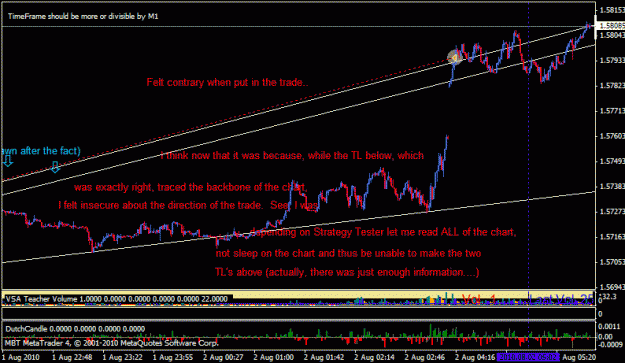
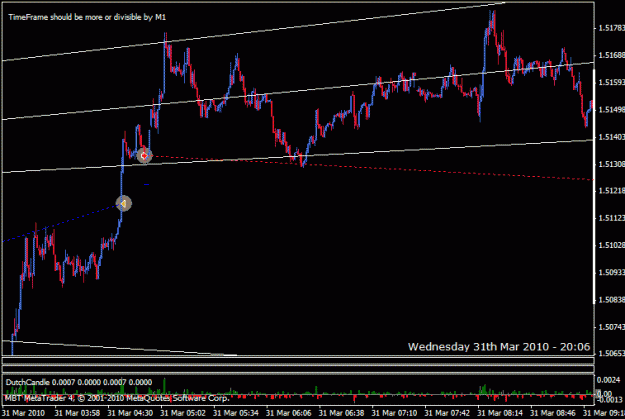
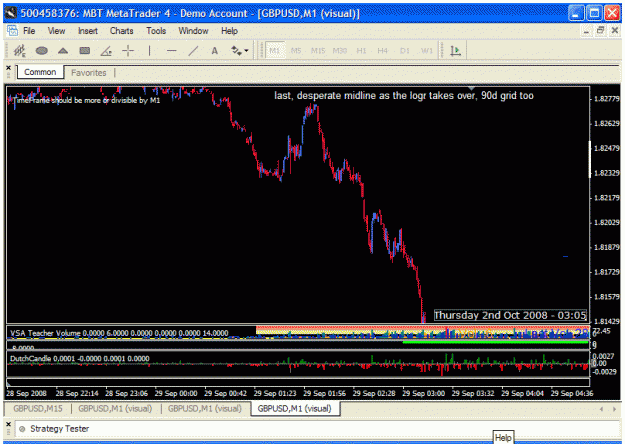
Latest method, emphasizing structure through the entire TF spectrum instead of one-area reading of the rest of the chart, even while still use latter temporarily when the one area can be used, simplified of extra TL's, to contribute to the overall structure with its own TL or three:
The current approach to doing line patterns, that is,
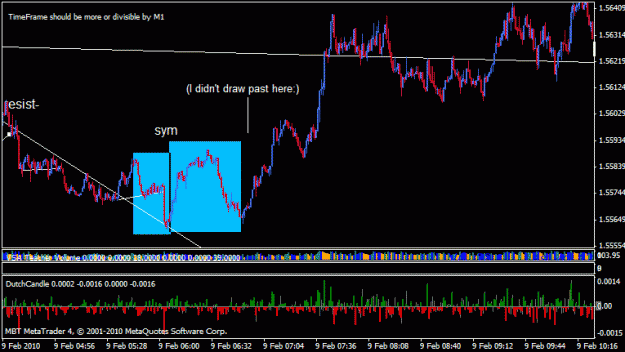
(at the lowest TF level) when the price-time line is stuck in one area, read each pivot trend angle and occasionally draw TL's
(at just-touching 1') often, no good overall shape appears and price-time line does have minor areas to midline a TL from; then, consecutive such TL's works
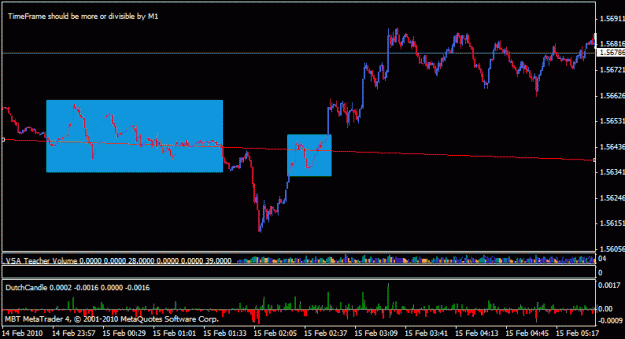
(at smashed-together 1') highlighting boxes, each typically around an overall shape of two opposing patterns with a centering pattern in the middle
(at the lowest TF level, searched for at the highest TF levels) singular overall shapes from which TL's intersect key areas for months, other overall shapes falling in place with it
(at the highest TF's) blur TL's that capture the price-time line's widest swath, so that no one place has a TL more important than another
------------
It was an interesting experience posting in ff's 'Interactive Trading' forum section again. The contributors to the thread I visited were friendly and professional.
Again, though, I found my post to be a single try, however good I believe it. Inconsistency is my downfall.
That, and the thread was for a different method than mine.
A couple of other threads in that forum section would be appropriate for me, if I get my own method running.
----
(revised)
MM:
"Cut losses short and let your winners run." Googled. Motivations for doing well at chart study are adjusting in-trade drawdown, fast decisions so that one cuts costs from a loss, reducing work effort and increasing consistent profit, etc.
Attachment
06262010 demo or less
#lots/SL
To avoid having to calculate at every price, I could just 'circle 20' (lots, SL) and proportionally go around that number if still unsure about a trade : Multiplier=divider; thus, 2 is 40 SL, 10 lots, for ex. Very loose, seems reasonable. TP, whatever I can get.
Attachment
review of a trading plan's effectiveness:
# of pivot trend angles (or rather, pivot trend angle pairs/trend-stops;
a turn represents a new pivot trend angle one has to interpret versus the prior history,
for its clarity of direction upon solid or temporary s/r
or for its indecision of direction upon solid or temporary TL;
since alot of trend cycles are complex when larger trends react to other immediately-close trends) included in a study,
entire areas of them, or only a series and one or a few at a time, are to be compared;
often, the # of pivot trend angles almost all going one way, and then one gets enough going the other way, varies;
opposing angles brings levels in heavily to react against fast, settle into that area, or react lightly to go to another, close area, depending on the # of pivot trend angles it takes before a match/opposition usually happens or on whether an s/r or a TL was reached;
variables:
pivot trend angle opposition clarity within each and creation of new s/r and TL,
opposition #, span and level in each side thus weight toward one direction,
opposition reaction to old s/r and TL
specificness of knowing a pivot trend angle versus its nadir (the pivot's turn point) or contents (various pressures from/to/thru the pivot trend angle, oft represented with TL's)--
from signal (only studying the peak of a vertical turn - type pivot, instead of the contents of the two trends that connect at that peak)
to TL (which highlight a number of pivot-angles' pieces,
making it needful for the TL to be specially made to reflect some pattern the chart reacts to regularly
(thus, line patterns, the fifth TL-making variable)),
rather than studying the pivot-angle and thus the nature of its contents directly --
and thus struggling with deriving the pivot trend angle's nature versus going for its singular or projected worth
speed one devotes to knowing one's pivot trend angles, in general being from simulator which is 32 minutes a real minute in the LFH simulator, to paper which, while being zero, ranges from an 1-10 minutes for a cursory study to one or more hours for an intense, wide-ranging study
and in divisions would be caustically troubling, since one may, without realizing it, study heartily before running up the simulator and more or less get the first few trades,
and then, from exhaustion/stubbornness, watch the next portion of the chart speed by and study during that time before trading on the information tacked onto the well-crafted study,
which is a disastrous or at least low-edge, levels -only (or similar overly simple) technicals, way to trade;
attitude, which for the variable speed example just given, would be confidence and then frustration and then a kind of desperation ("When will that chart do (what I want) -- Up-down (or always up) and always disobeying me (when I feed it random, contrary-plan trades)" -- gotta laugh at myself, after the fact)
which is fine if I recognize and then stop it, to correct what's under my control to correct my reaction to what's causing the negative attitude,
since pivot trend angles, alongside the variability of the timing of how orders enter recorded onto the chart (i.e., the variability of order flow, which is missing in most simulators), are what intuition in reading charts does, even before feeding one's indicators' / drawing devices' info to gut instinct to yea/nay a trade -- and thus, a contribution to the attitude would be a gastric disturbance from odd-speed study sessions ( : ) );
another is confusion and distancing when one overly focuses on making TL's or taking pivots for granted, which expands specificness to the maximum while ignoring trend angles, their center
precision a simple beginning approach that gets the overall-direction TL and fits with blur, so anyone can check the effectiveness of a trading plan with this method
variables:
opposition clarity
within each
and creation of new s/r and TL,
opposition #,
span
and level in each side thus weight toward one direction,
opposition reaction
to old s/r
and TL[/list]
_________________________________________________________________
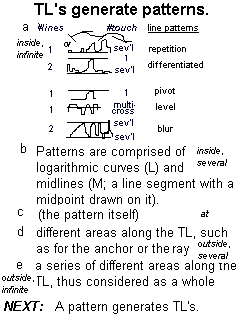
TRENDLINES: Introduction
The textbook definition of a TL positions a line at the edge of a large area so that only the pivot turns are fairly represented.
The TL's look 'different' because I deconstructed and reworked the definition.
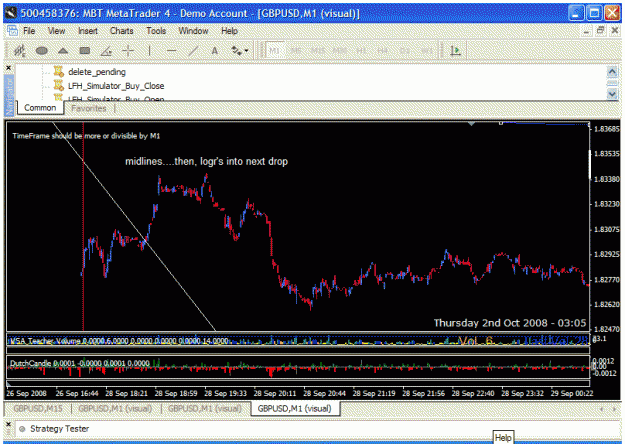
Price forms in two ways: Logarithmic curves and midlines. A definition of logarithmic curves is here; I only use the face-value, no math. A midline is a line segment with a dot at its middle; in MT4, just highlight the TL.
Because of this, I prefer to include with the definition of TL's --
- combos: This definition fails to consider either strong one-way energy from logr curves or neatly counterbalanced energies from midlines. You may say that, well, a fan works for the former and a channel for the latter. These are often crude devices, though, when an originally-drawn TL that considers the smaller-TF logr's and mid-'s and also other TL's creates a more accurate representation of both.
- subtlety: A TL forms around a row of especially clear examples of logarithmic curves and midlines. Furthermore, a lower TF's logr or midline may slightly adjust where to represent a higher TF's mix of logr's or midlines.
_________________________________________
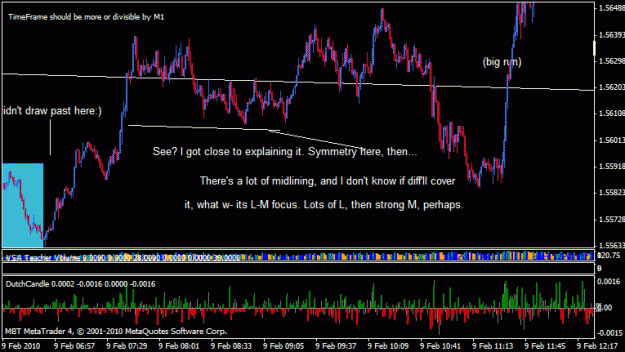
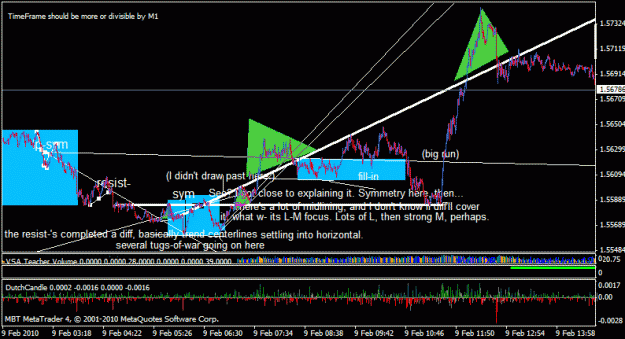
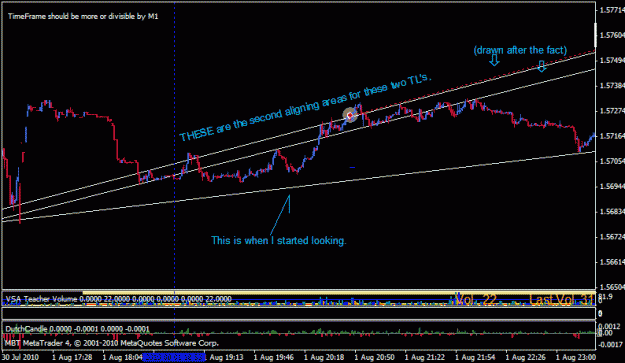
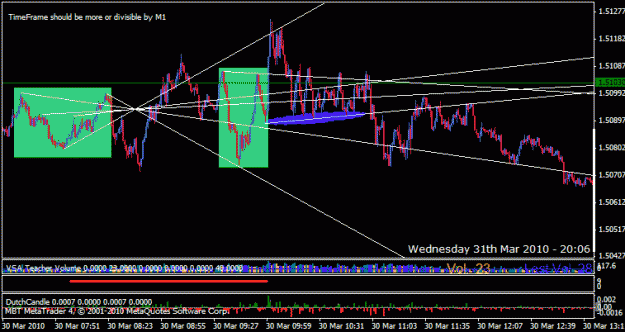
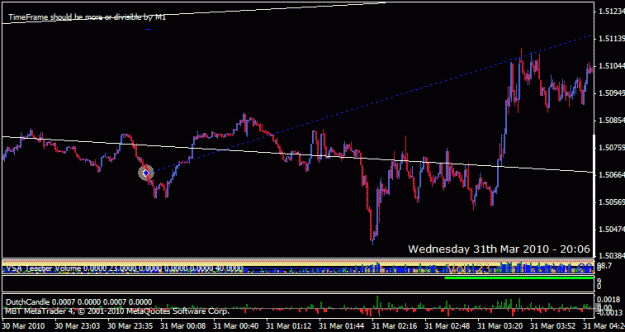
The occasional clarity of price to form logarithmic curves and midlines is such that distinctive patterns often appear, whereupon TL's can be drawn within or around the patterns by following the alignment the logr's and mid-'s, which price forms, create. Sometimes it only takes one pattern to create one or more TL's. Other times, it's easier to align logr's and mid-'s that are few in bunches or only one and align with others that are far away, as long as larger logr's and mid-'s respond to the TL being created in order to justify drawing the TL.
Recently, I found that certain features of the two trends on either side of a pivot turn are very important in determining direction. It is more centering than the TL's it sometimes help create, and defines a pattern one compares to others that look the same only are a mirror reflection or other version. Thus, patterns can directly decide a direction, on occasion. Just as often, it's a TL that price surrounds.
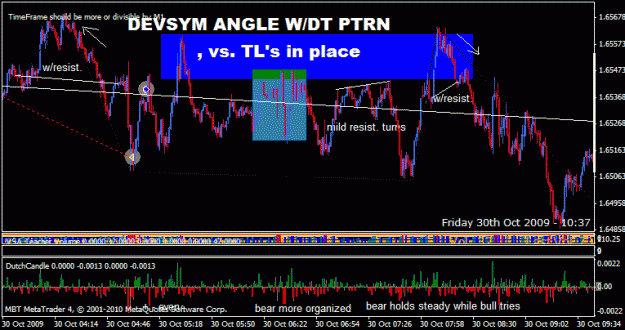
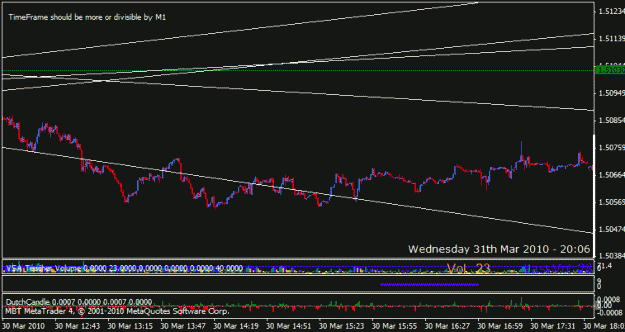
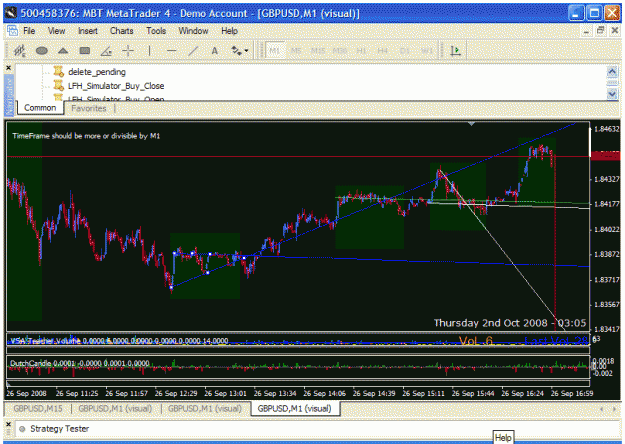
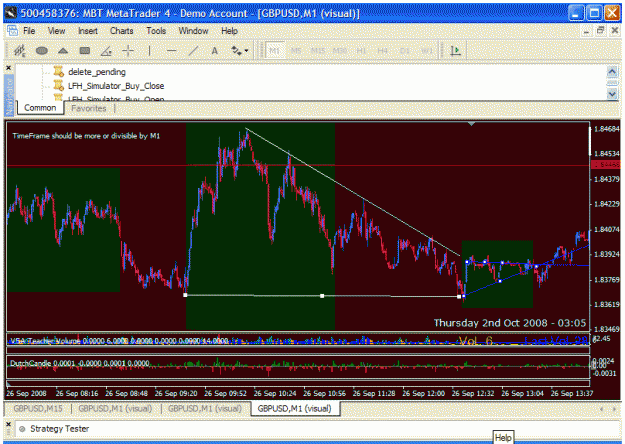
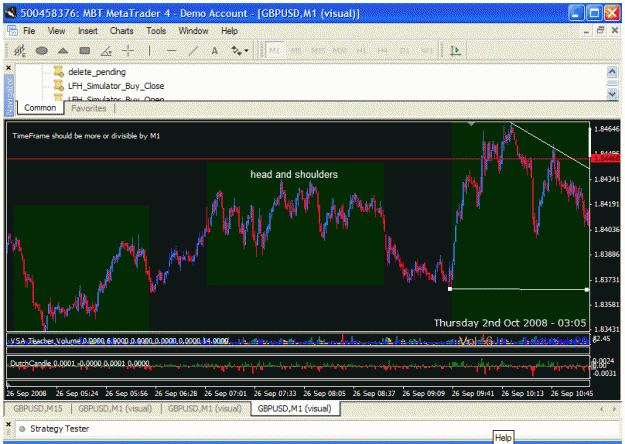
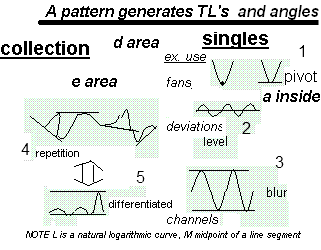
VOLATILITY AREAS through TF's:
one trendline drawing method each
The current approach to doing line patterns, that is,
(A at the lowest TF level) bound when the price-time line is stuck in one area, read each pivot trend angle and occasionally draw TL's
(B at just-touching 1') volatile often, no good overall shape appears and price-time line does have minor areas to midline a TL from; then, consecutive such TL's works
(C at smashed-together 1') symmetric highlighting boxes, each typically around an overall shape of two opposing patterns with a centering pattern in the middle
(D at the lowest TF level, searched for at the highest TF levels) a gaggle of lead singular overall shapes from which TL's intersect key areas for months, other overall shapes falling in place with it
(E at the highest TF's, copies of the TL's put onto trading chart (1') ) blur TL's that capture the price-time line's widest swath, so that no one place has a TL more important than another in the overall
TL areas line patterns cover:
Attachment .
"It's not how, it's how well."
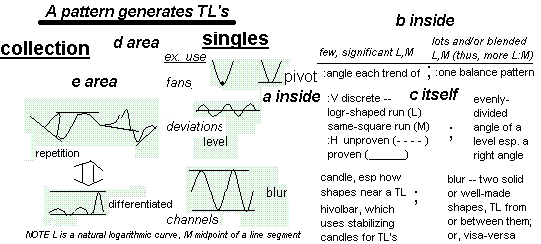
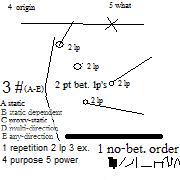
TRENDLINE variables:
- 1. angle stress (dot)
pivot trend angles --measuring the angle,
finding regularities for TL's or other traditional trend
features, and figuring several pivots together
for a larger direction;
TL's breaking up each pivot's connected
two (or so, if considering a larger pivot) trends,
in order to be approximators or batchers for getting
through pivot trend angles more easily - 2. barricade (level)
shape pivots, and thus TL's, are made of:
logr <>midlines - 3. level differentiation (blur)
simple vs. repetition-based structure,
vs. 0 45 90 - degree direction and thus, often,
a channel deviation or gap fill or a fan side choice,
underlying line patterns; complex shape (circle,) - 4. repedity; i.e., # + velocity
(& a little of size) (rep)
#dir'n (1s, 2s) balance of same;
contrast of TL's from different sources - 5. surround (diff)
cycles of line patterns through periods
of high parallelism, of a single area's parallelism
that derives the major TL's,
and of low parallelism
and a nearly-continuous string of line patterns
that are merely small areas
of midline-controlled logr's.
all, some or none that is on-balanced
and not just having a TL
through decent midlines
through a series of various shapes --- pattern-matching
w/short, simple, dotted hz lines; - one pattern to match within,
with its derivative TL's; - and, TL's to draw one
after another matching each trend
- pattern-matching
line pattern examples,
broken down to recognize cycles --
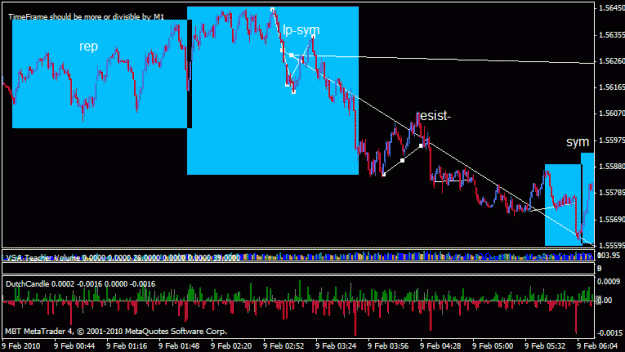
_____
(a high-parallelism chart area) *
Attachment
SKEWED, MESSY
representative examples -- with a variables-list description, template (EST), and detailed chart pictures -- 5-10 each, of ten divisions (five types, each with an L,M and L:M side to it) of the range of possible line patterns
area ex. 1: 12182009 1503EST to 12302009 0945EST
1) pivot, L,M
1a) pivot, L:M
i a variables-list description, template (EST), and detailed chart pictures (1,2,3)
ii a variables-list description, template (EST), and detailed chart pictures (1,2,3,4,5,6)
2) level, L,M
i a variables-list description, template (EST), and detailed chart pictures
2a) level, L:M
i a variables-list description, template, and detailed chart pictures (1,)
ii a variables-list description, template (EST), and detailed chart pictures (1,2,3,4,5)
iii a variables-list description, template (EST), and detailed chart pictures
3) blur, L,M
3a) blur, L:M
i a variables-list description, template (EST), and detailed chart pictures (1, 2, 3)
4) rep, L,M
4a) rep, L:M
i a variables-list description, template (EST), and detailed chart pictures (1, )
5) diff, L,M
5a) diff, L:M
i a variables-list description, template (EST), and detailed chart pictures (1,2,3,4,5,6,7,8,9,10)
mix
i
SELECT OR REPLACE WITH THE VARIABLES
the ten divisions (five types, each with an L,M and L:M side to it) of the range of possible line patterns
,each sample with a variables-list description, template (EST), and detailed chart pictures
,broken down to draw TL's in a low-parallelism area
-- a midline area of various size (small, average, large)
and sometimes using small-pattern series (which is read) or small-area separation (which presents more skewed and/or longterm TL's) to modify the central approach of midline areas --
and the other such areas
area ex. 2: various times (11252009 1503EST to 12182009 1503EST and some 06232010 1030EST +)
1a) pivot, L:M
i a variables-list description, template (EST), and detailed chart pictures
2) level, L,M
i a variables-list description, template (EST), and detailed chart pictures
ii a variables-list description, template (EST), and detailed chart pictures
2a) level, L:M
i a variables-list description, template (EST), and detailed chart pictures
3a) blur, L:M
i a variables-list description, template (EST), and detailed chart pictures
5) diff, L,M
i a variables-list description, template (EST), and detailed chart pictures
_____
PLAIN AND CONSISTENT,
EVEN IF MISSES THE POINT
i low- (with good, early detection of single-line mid-'s)
a variables-list description, template (EST), and detailed chart pictures
ii low- (with fair, early detection of single-line mid-'s)
a variables-list description, template (EST), and detailed chart pictures
iii low-, w/highlighted a (proposed) mid-area
a variables-list description, template (EST), and detailed chart pictures
* iv mid-, w/ex. of a small high- area
a variables-list description, template (EST), and detailed chart pictures
v high- area, unvariegated of any possible low- or mid- areas within
a variables-list description, template (EST), and detailed chart pictures
TRADEABLE:
PIVOT TREND ANGLES FIRST, TL'S ONLY IF HELP
efforts
- a variables-list description triple-opps, template (EST), and detailed chart pictures
- a variables-list description, template (EST), and detailed chart pictures
- a variables-list description, template (EST), and detailed chart pictures
- a variables-list description, template (EST), and detailed chart pictures
-----
bsTL microverse: Overview, patterns (or, those with fewer or more candles), TF use, trading. (And its future: automatic; precise.) simulator