I'm calling the last post's chart study, "TL Cycles".
example:
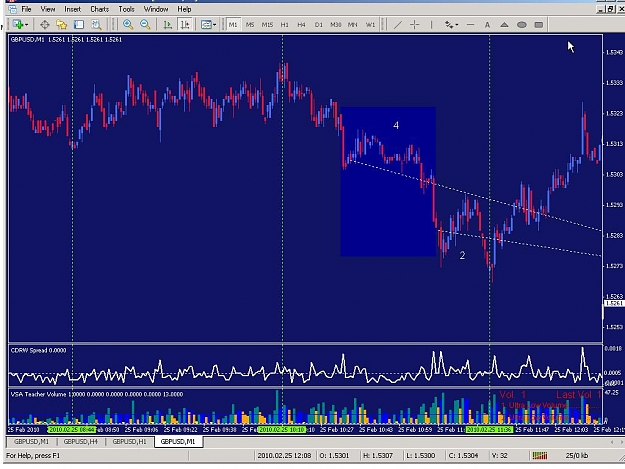
Trade each trend. Next trend is 858 to 1550. Previous trend already mapped. Draw a temporary skew line into the next trend's area to get the general idea of where everything can be. Enter trend. Use TL's extended from the last trend and from the cycle's overall attributes, that is, any older lines that may affect the next trend.
(overall, showing where the next trend is (lawn (bright) green vertical dashed lines, skew lines into next trend (lower two (dark) blue lines)))
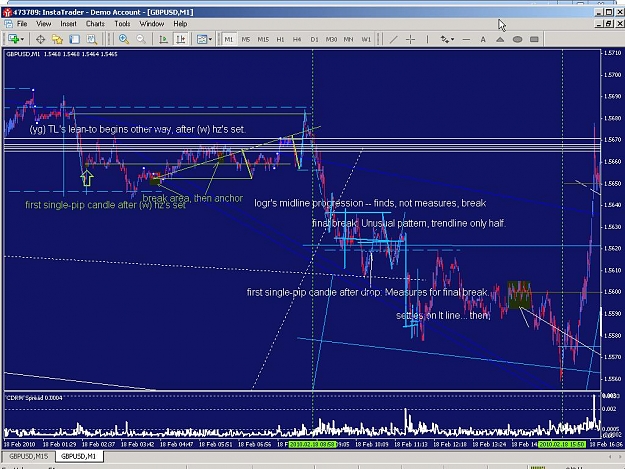
A more complete example would include a series, for example deviation trend - skew into grid - grid - off-grid (ex.: flat) - skew into deviation trend - deviation trend. Note that there is no skew necessary between grid and off-grid, as the flat (in this ex.; vert, or flat and vert, in other ex.'s) 'converts' the grid into another grid. There can be a bunch of midlines expanding a grid area into an off-grid, perhaps.
A skew is
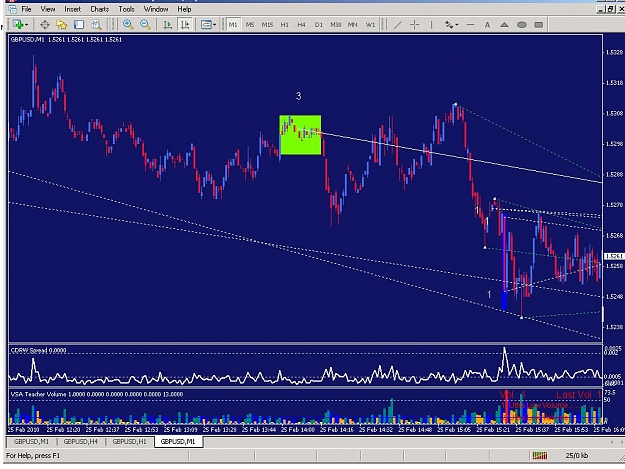
local (noted in label of picture above),
inter-area (the upper (dark) blue line in the picture above),
in-line (that is, from the overall TL cycle; the older white lines cutting through the price-time line in the picture above),
close-up (or exuberance levels, some of the lines (angled lines in an anchored area, or visa-versa, and sometimes a grid inclusion with anchored lines or deviation inclusion with angled lines) that are short and with limited affect within the body of one of the all-TF cycle's areas),
or news close-up (vertical exuberance levels that skew only within one 1' candle).
A skew is anchored, thus definitionally opposal to and/or replacive of the grid, which is a pairs-supportive idea.
example:
Trade each trend. Next trend is 858 to 1550. Previous trend already mapped. Draw a temporary skew line into the next trend's area to get the general idea of where everything can be. Enter trend. Use TL's extended from the last trend and from the cycle's overall attributes, that is, any older lines that may affect the next trend.
(overall, showing where the next trend is (lawn (bright) green vertical dashed lines, skew lines into next trend (lower two (dark) blue lines)))
Attached Image (click to enlarge)
A more complete example would include a series, for example deviation trend - skew into grid - grid - off-grid (ex.: flat) - skew into deviation trend - deviation trend. Note that there is no skew necessary between grid and off-grid, as the flat (in this ex.; vert, or flat and vert, in other ex.'s) 'converts' the grid into another grid. There can be a bunch of midlines expanding a grid area into an off-grid, perhaps.
A skew is
local (noted in label of picture above),
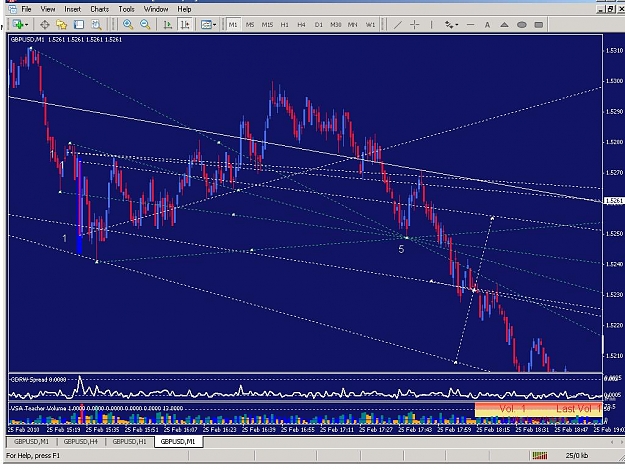
inter-area (the upper (dark) blue line in the picture above),
in-line (that is, from the overall TL cycle; the older white lines cutting through the price-time line in the picture above),
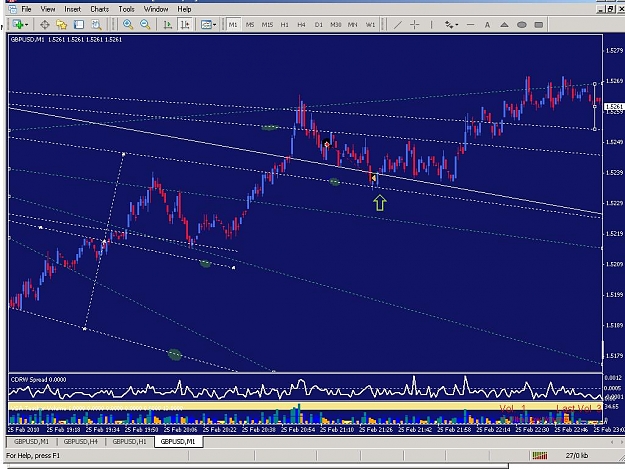
close-up (or exuberance levels, some of the lines (angled lines in an anchored area, or visa-versa, and sometimes a grid inclusion with anchored lines or deviation inclusion with angled lines) that are short and with limited affect within the body of one of the all-TF cycle's areas),
or news close-up (vertical exuberance levels that skew only within one 1' candle).
A skew is anchored, thus definitionally opposal to and/or replacive of the grid, which is a pairs-supportive idea.