Didn't.
Waited for a motivation. Here it is.
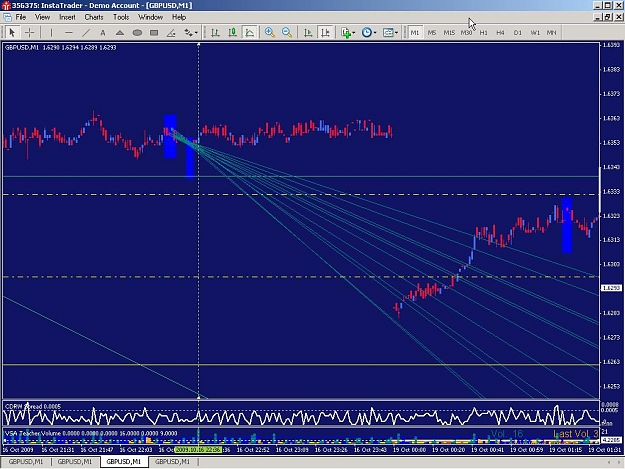
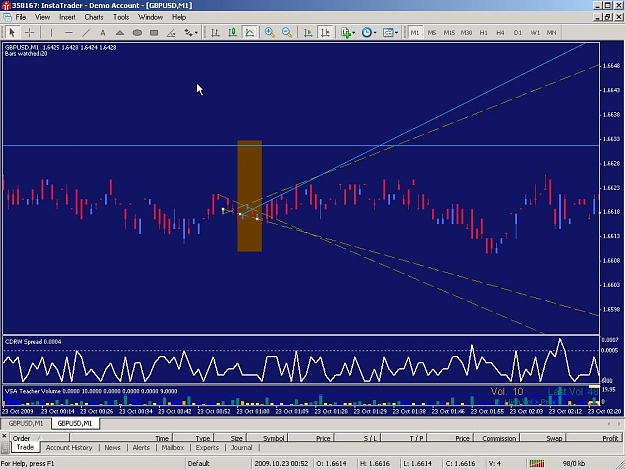
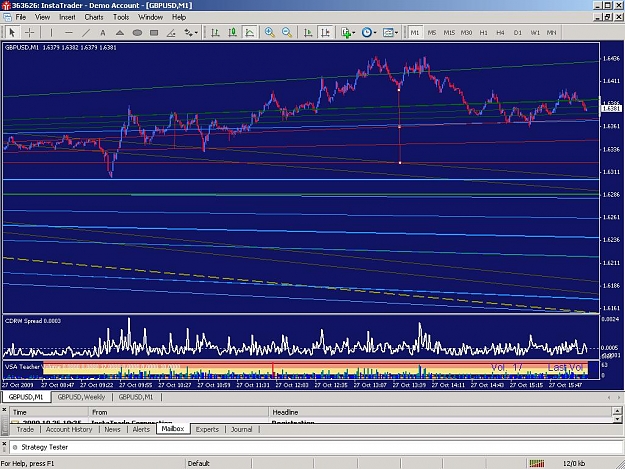
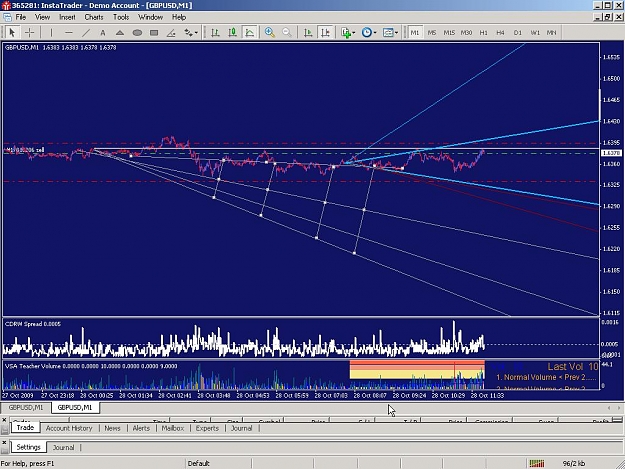
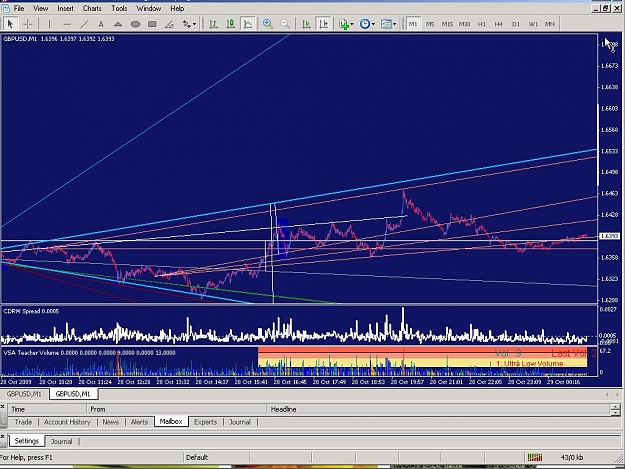
The creativity and luck involved in finding the right small-spread TL's to show the pivots of the next chart area makes them so random as to be nearly useless in charting anything.
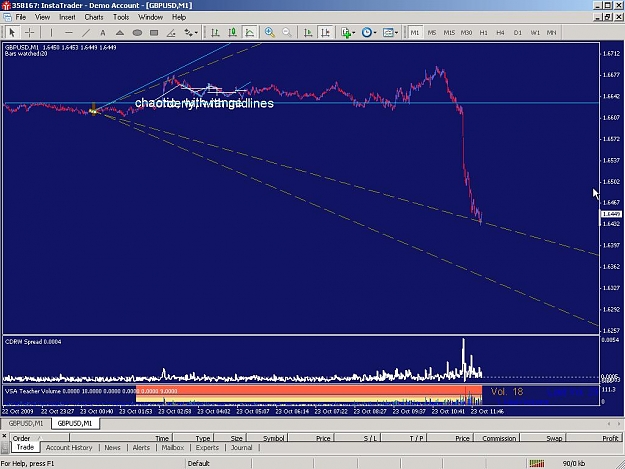
Take any one significant area, and yes, you can, with a little practice, draw bsTL's to trade that area. Try and go rapidly along the price-time line at fully condensed 1' TF, and you get a big mess. You can skillfully interweave a trend, countertrend, deviation and local extreme spike type of bsTL; only, this delays the inevitable, that, looked at closely, the chart represented with bsTL's alone will fail.
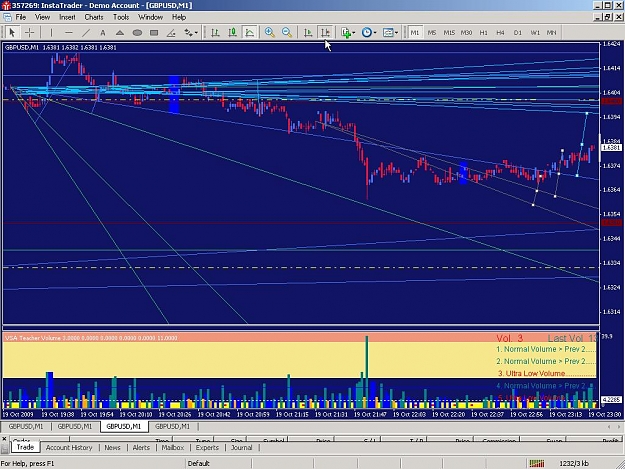
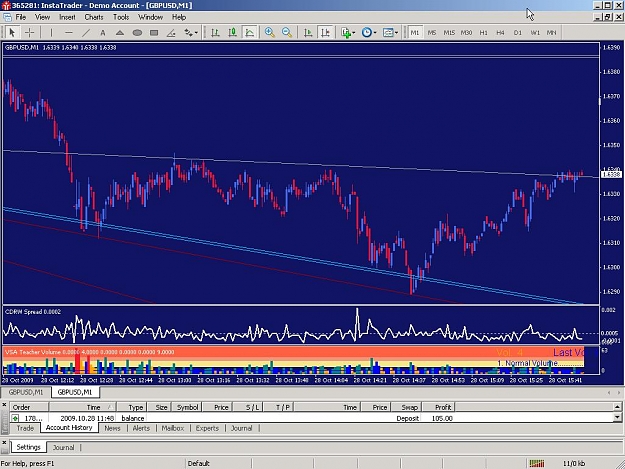
So I need an approach that skillfully uses bsTL's and avoids their inconsistent, localized nature for an overall view at any separation of 1'TF bars.
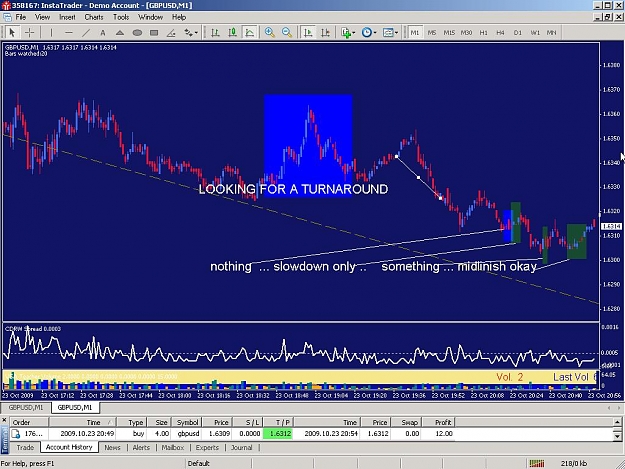
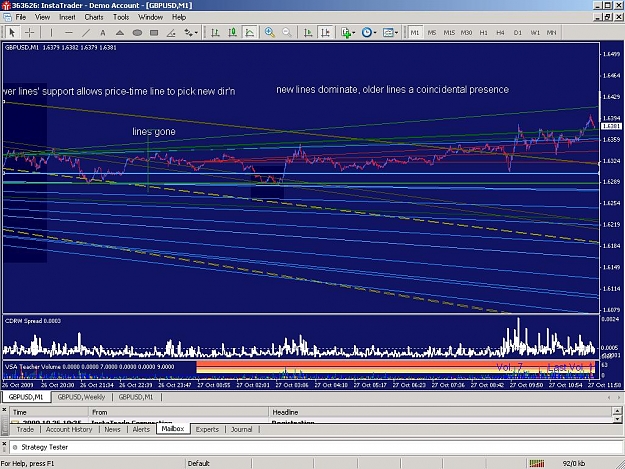
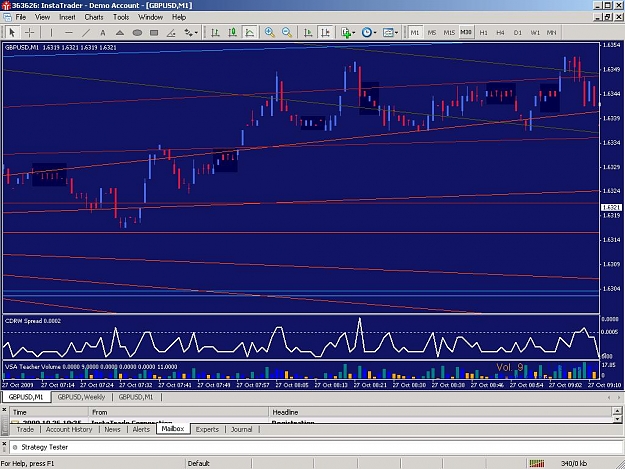
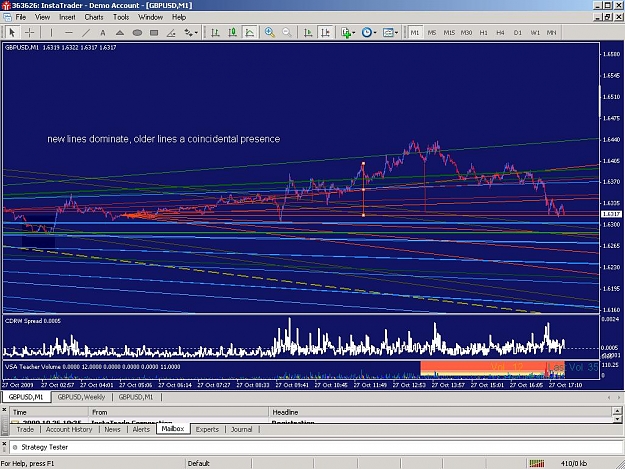
One way is the varying lengths of horizontal line, imagined or close to real. Another is contrast, dealt with very carefully. I guess I'm ready to include small bsTL patterns and their intrinsic ability to say which direction the price-time line will go.
-----
(revision)
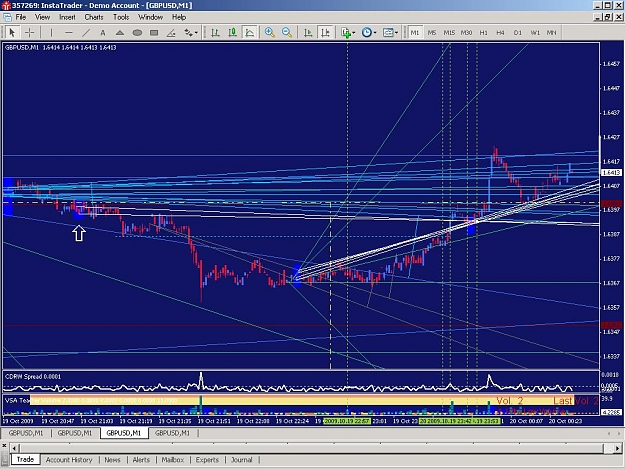
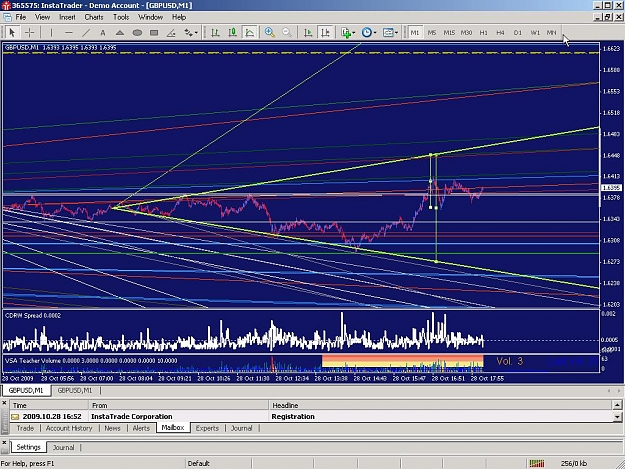
Oh yeah, forgot round numbers. Great center line, as noted in another thread.
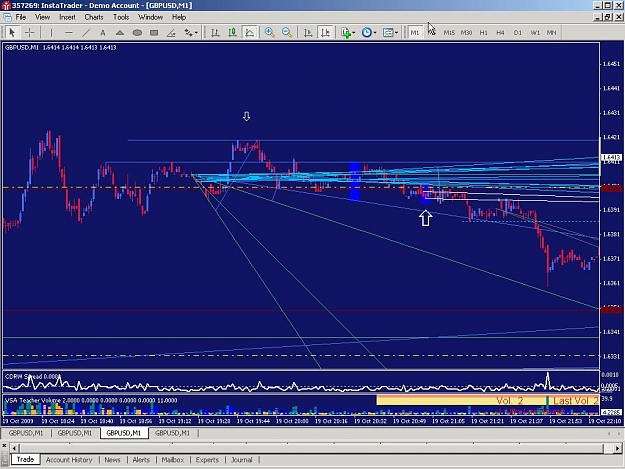
Horizontal line (segments):
(dot) logic dot from midlined balance areas
(short line) positioned sides (including patterns in middle or on either side of a TL, such as balance lines)
(medium line) hyperdot
(long line) midlined balance areas
((infinite) line) round numbers
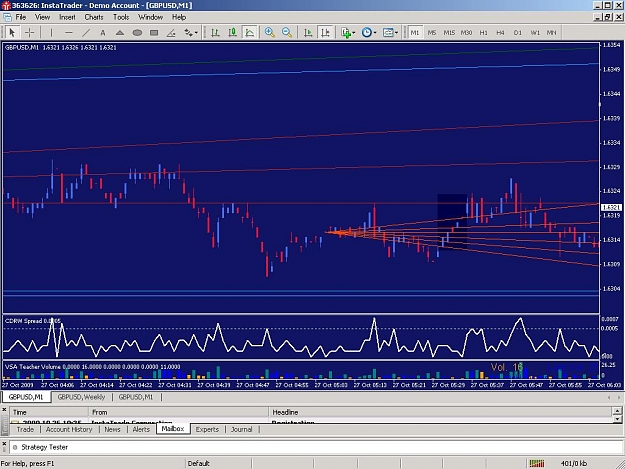
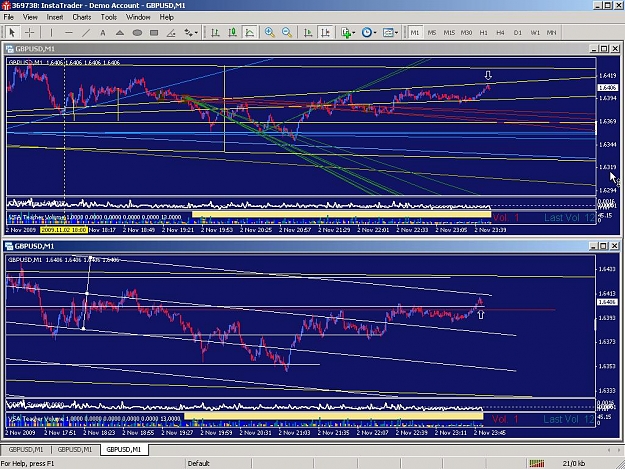
-- Choose a bsTL pattern that deviates from each type of horizontal line in the (1*1-scaled) chart area, noting the pattern's intrinsic angles to be derived.
Waited for a motivation. Here it is.
The creativity and luck involved in finding the right small-spread TL's to show the pivots of the next chart area makes them so random as to be nearly useless in charting anything.
Take any one significant area, and yes, you can, with a little practice, draw bsTL's to trade that area. Try and go rapidly along the price-time line at fully condensed 1' TF, and you get a big mess. You can skillfully interweave a trend, countertrend, deviation and local extreme spike type of bsTL; only, this delays the inevitable, that, looked at closely, the chart represented with bsTL's alone will fail.
So I need an approach that skillfully uses bsTL's and avoids their inconsistent, localized nature for an overall view at any separation of 1'TF bars.
One way is the varying lengths of horizontal line, imagined or close to real. Another is contrast, dealt with very carefully. I guess I'm ready to include small bsTL patterns and their intrinsic ability to say which direction the price-time line will go.
-----
(revision)
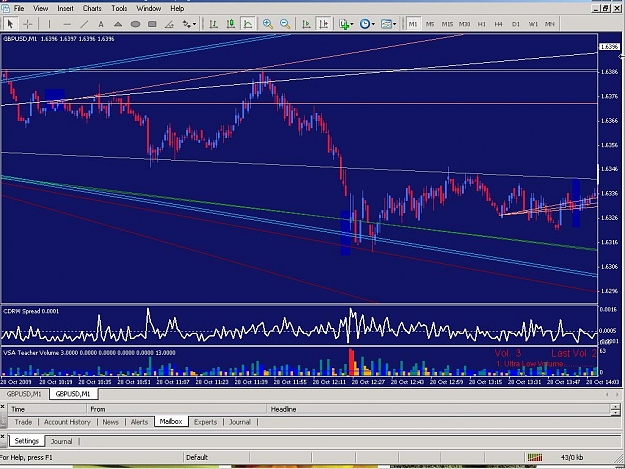
Oh yeah, forgot round numbers. Great center line, as noted in another thread.
Horizontal line (segments):
(dot) logic dot from midlined balance areas
(short line) positioned sides (including patterns in middle or on either side of a TL, such as balance lines)
(medium line) hyperdot
(long line) midlined balance areas
((infinite) line) round numbers
-- Choose a bsTL pattern that deviates from each type of horizontal line in the (1*1-scaled) chart area, noting the pattern's intrinsic angles to be derived.