1 2
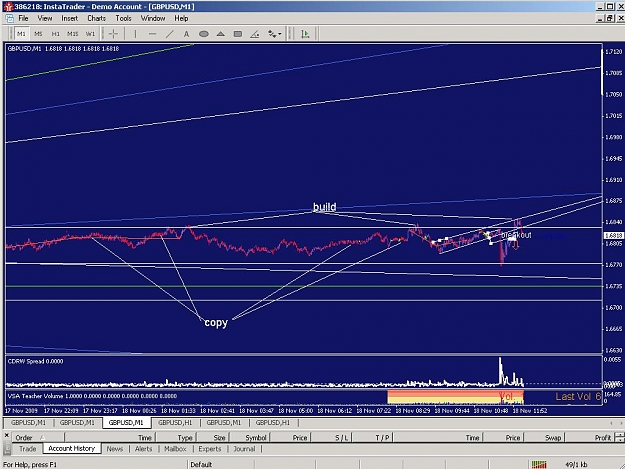
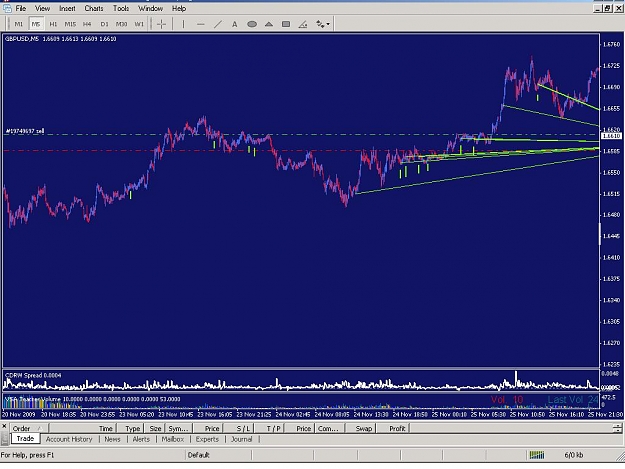
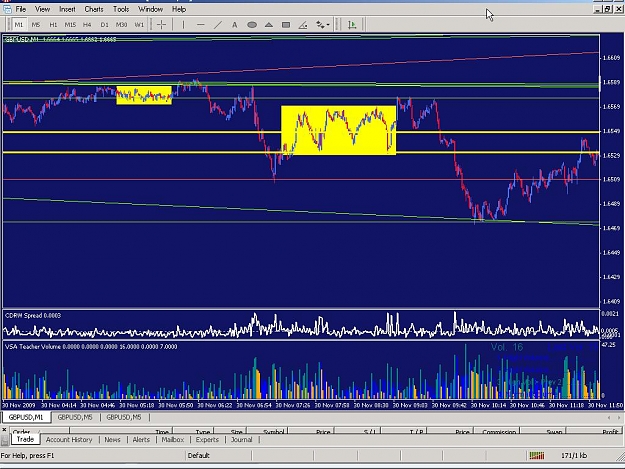
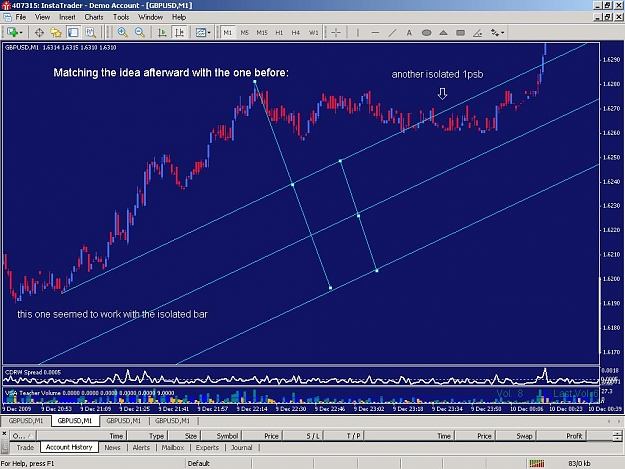
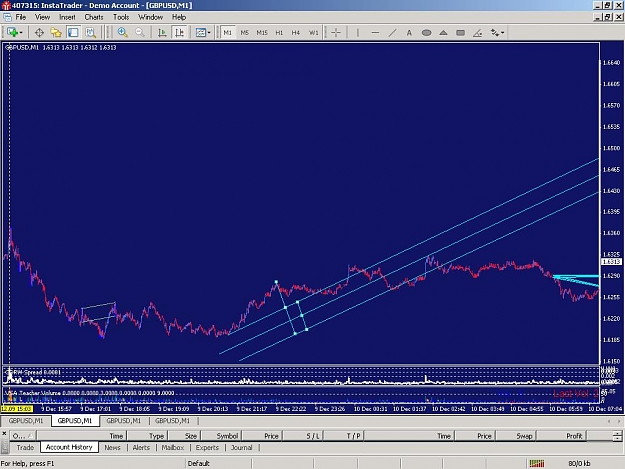
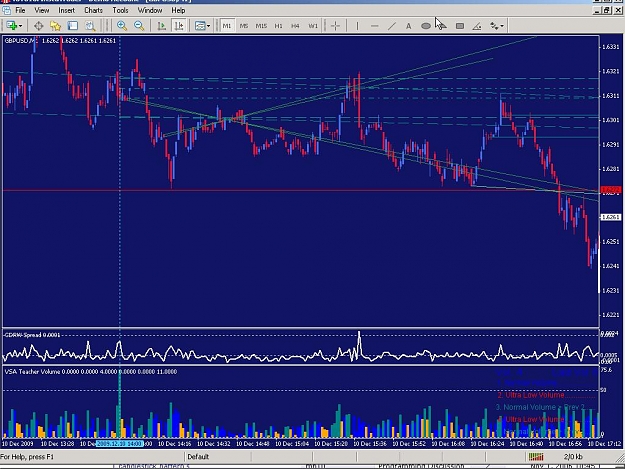
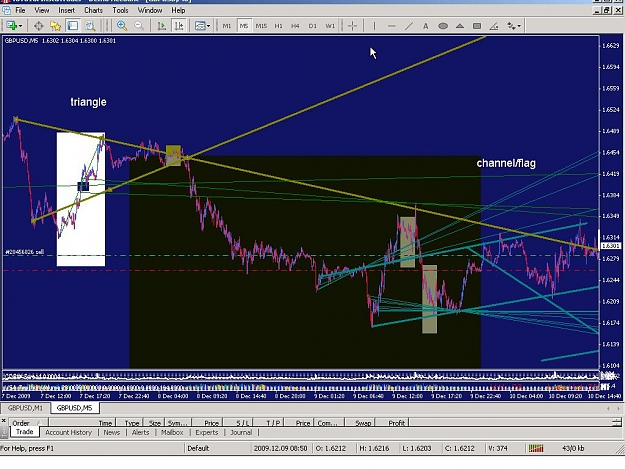
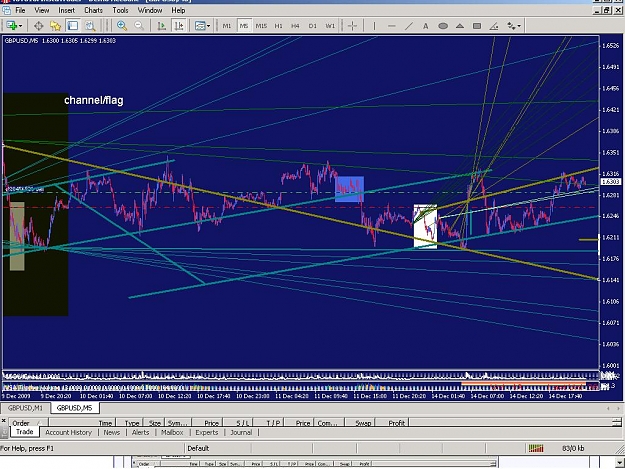
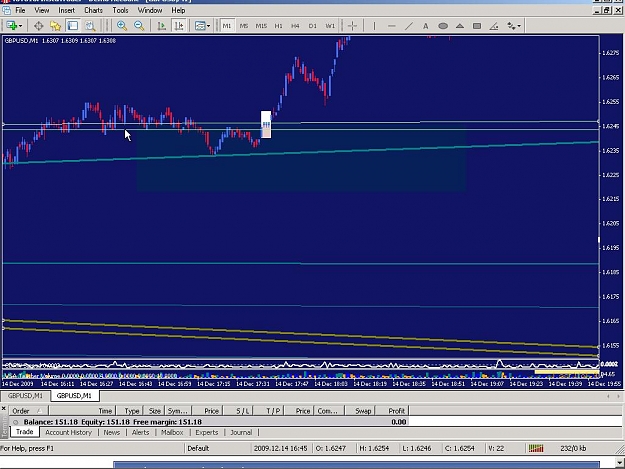
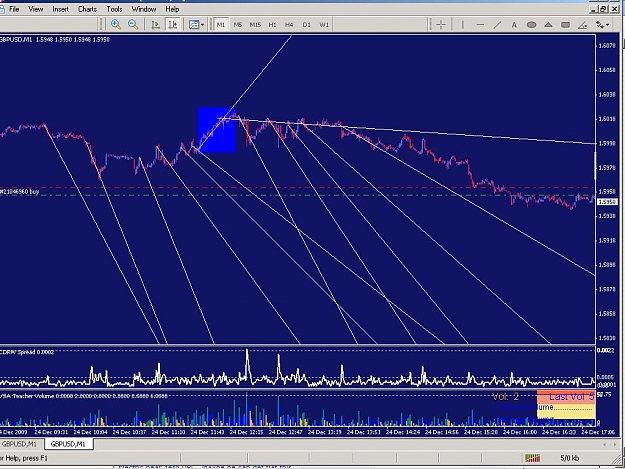
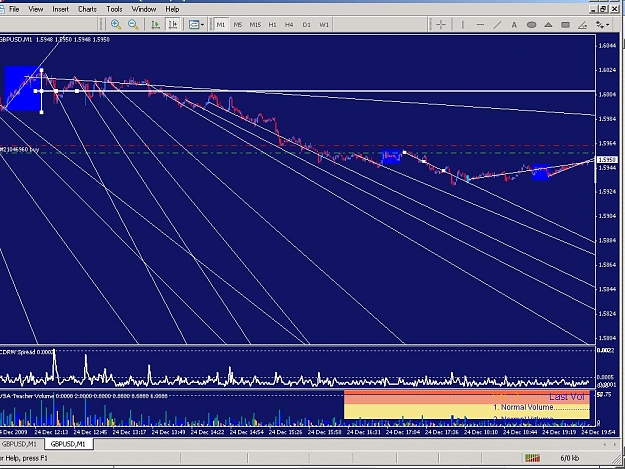
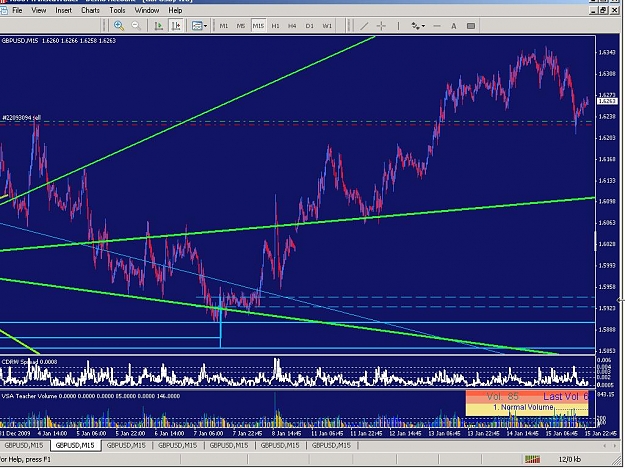
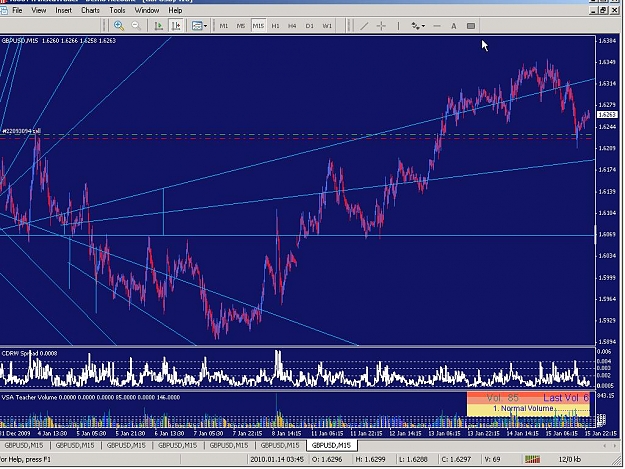
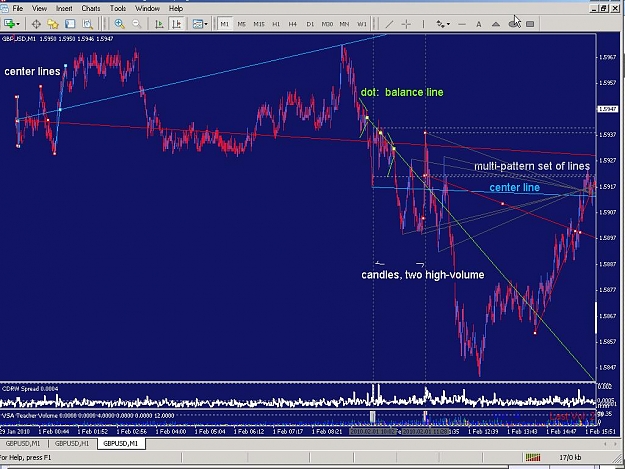
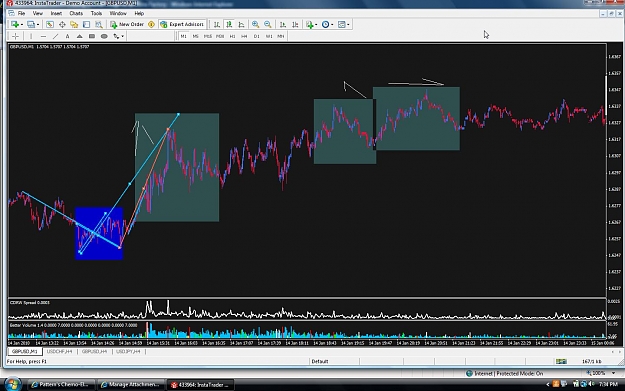
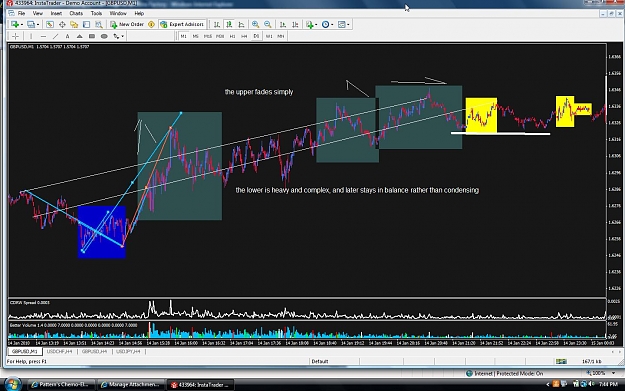
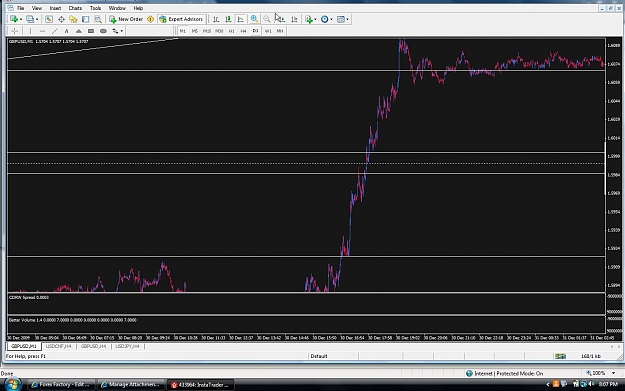
Achieved about 10% each of yesterday and today, using the new hand-drawn same-spread bar channels approach to close-up work (found in 'balance lines' thread.) It was a fairly easy 24h, after the 30+ and the 50+ flattening the g/u into easy waves. That is, easy enough for a new approach like mine to stick to enough to get by with.
It's a good feeling surrounding and being fairly certain about, instead of taking pot shots at and getting what is then partially justifiably worked up over, the next price-time trend.
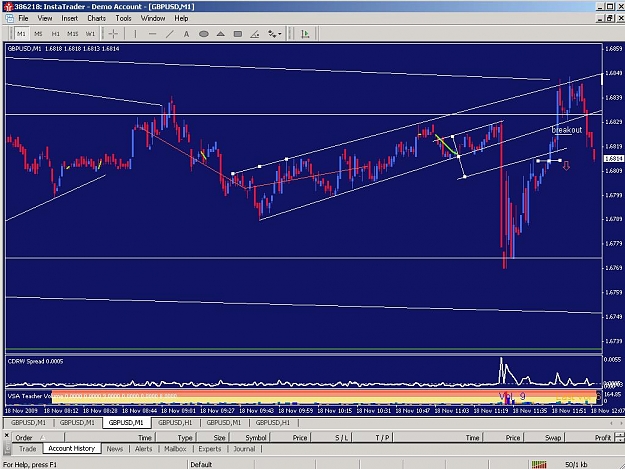
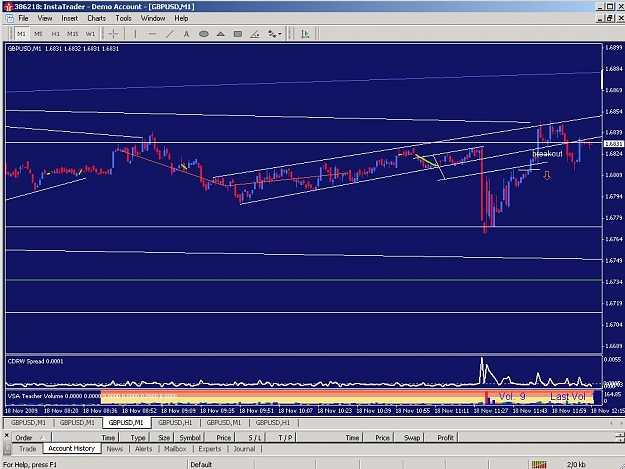
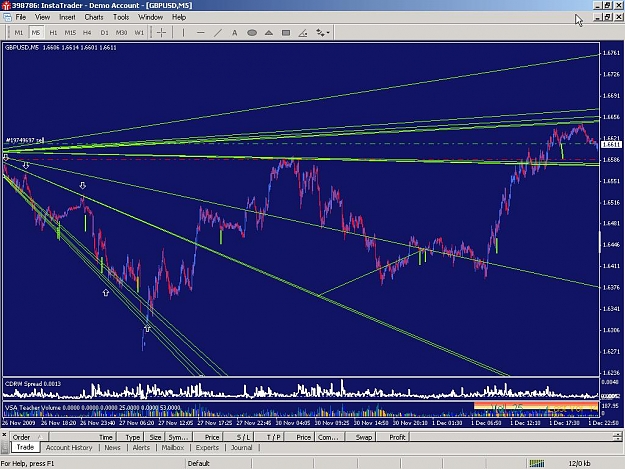
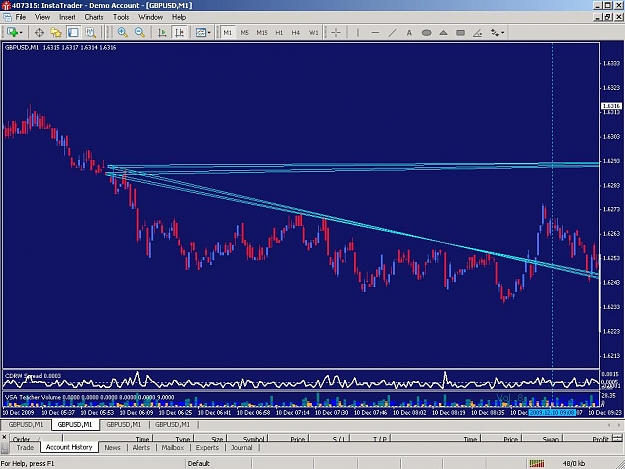
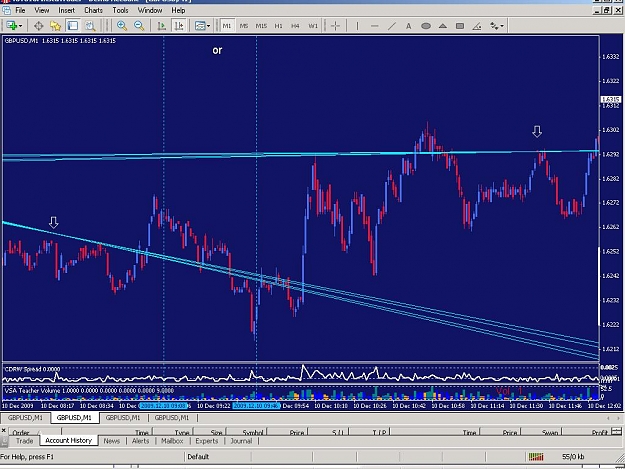
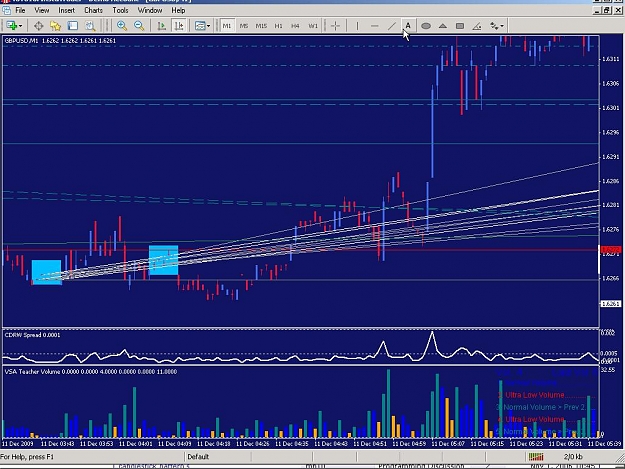
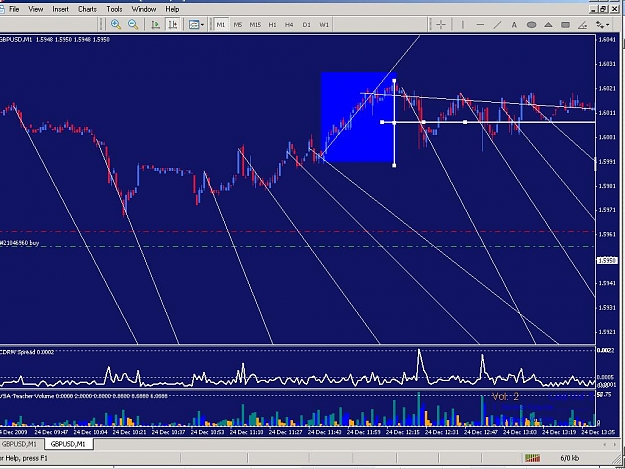
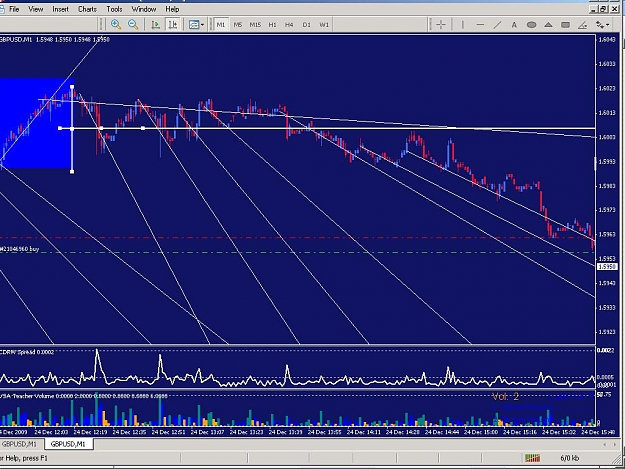
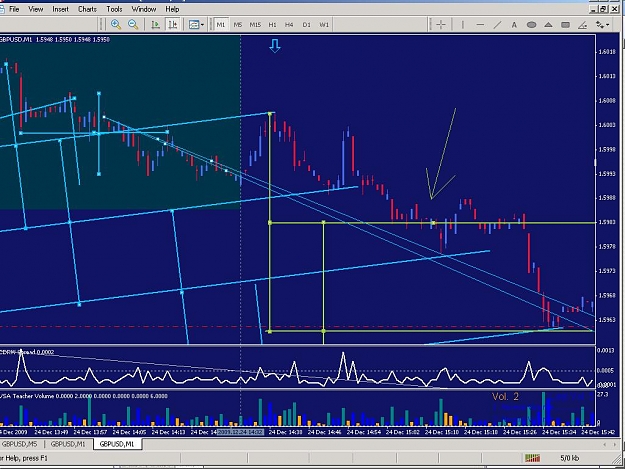
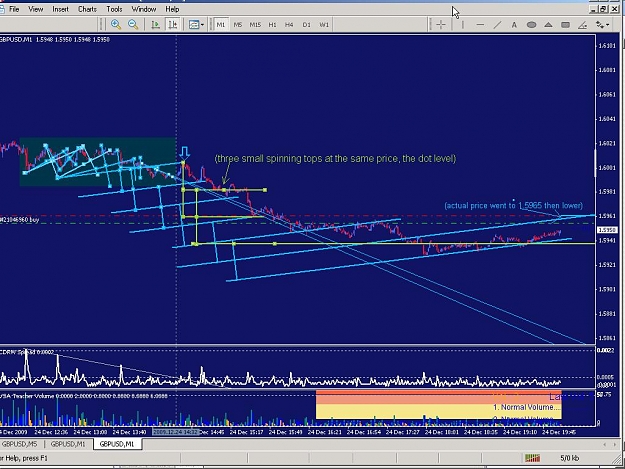
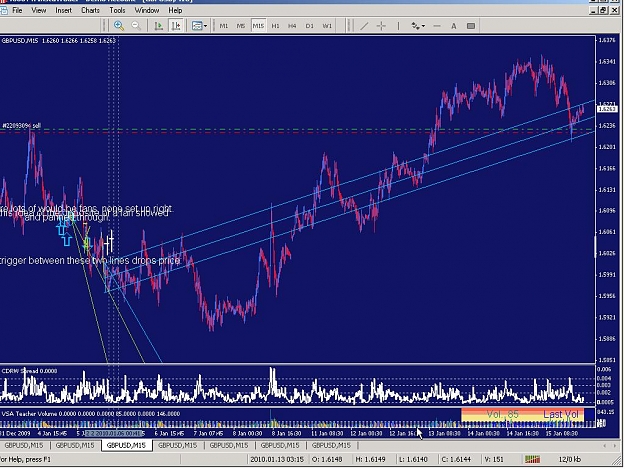
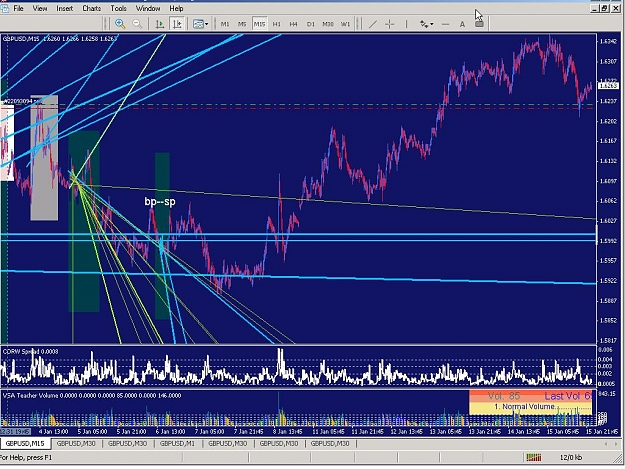
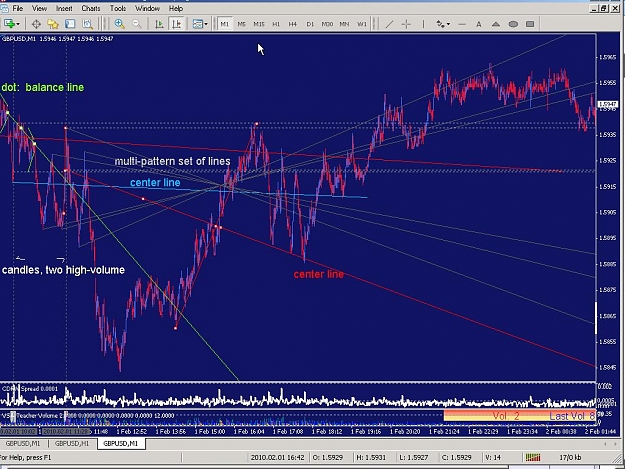
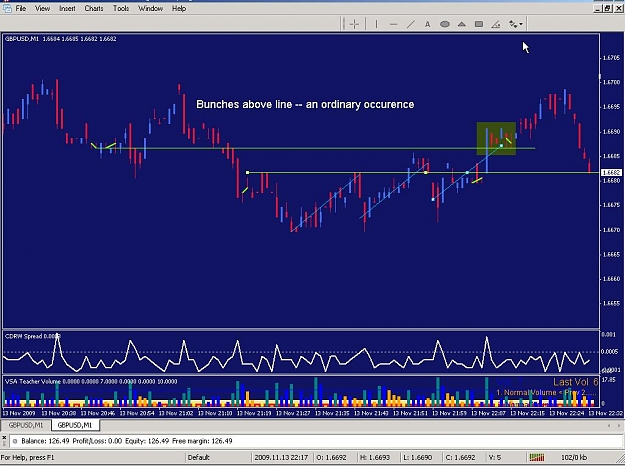
One basic mistake I made was on a good opportunity to explain the multiple trend with trend centerlines (in deep sky blue lines), here. Just including that concept regularly should help to develop it. Price seemed to jump above the (yellow-green rectangled) bunch.
-----
Also:
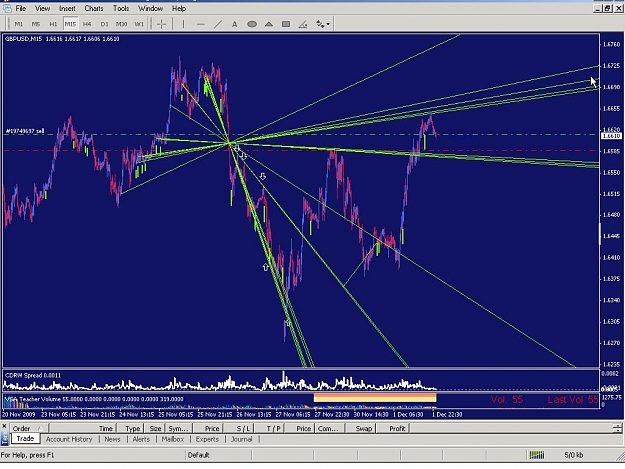
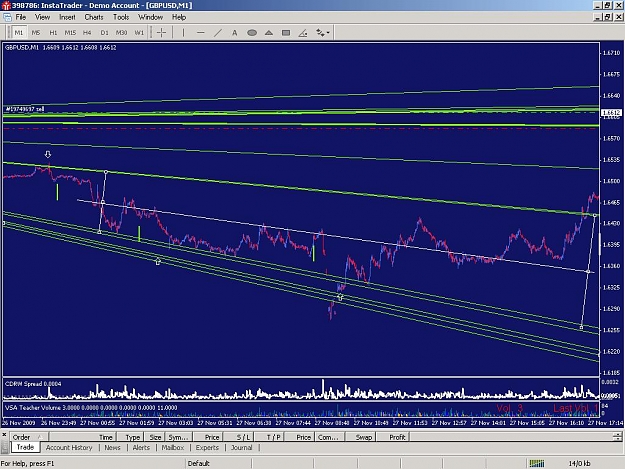
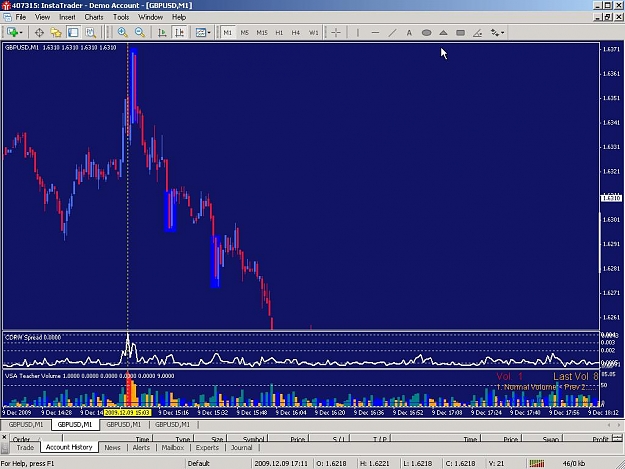
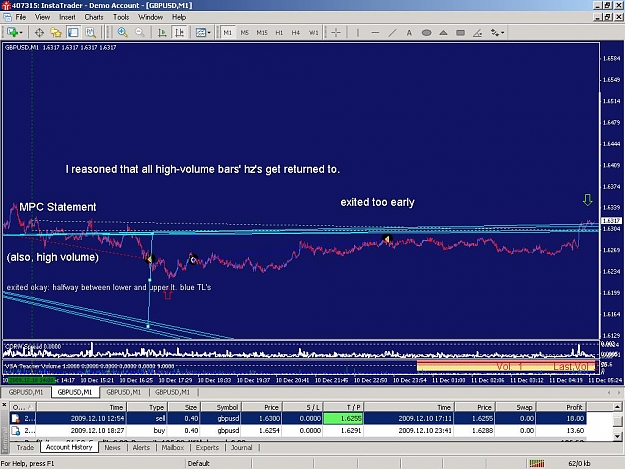
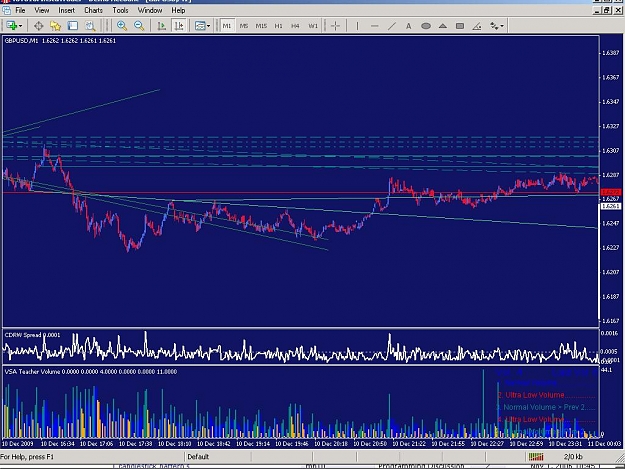
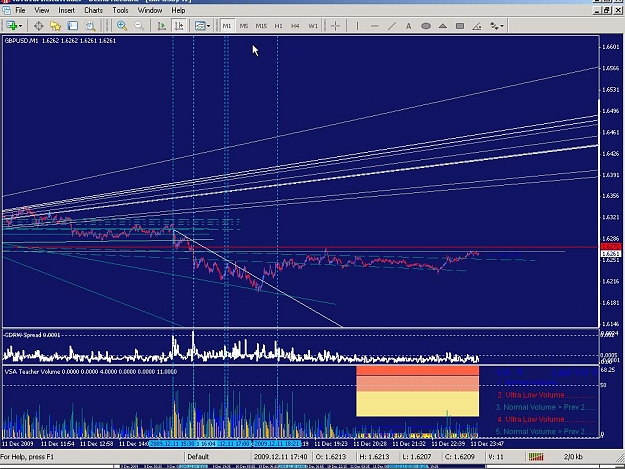
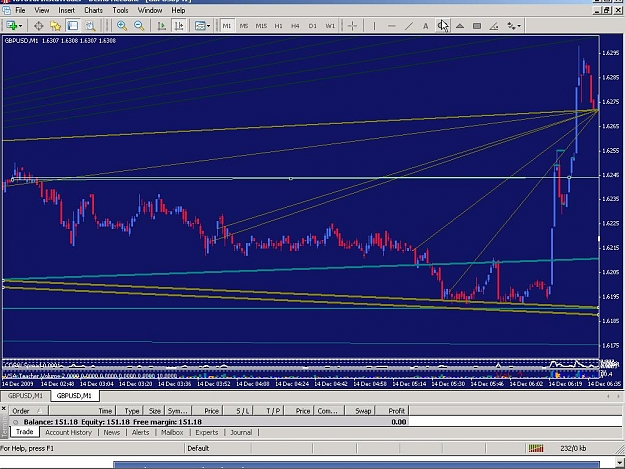
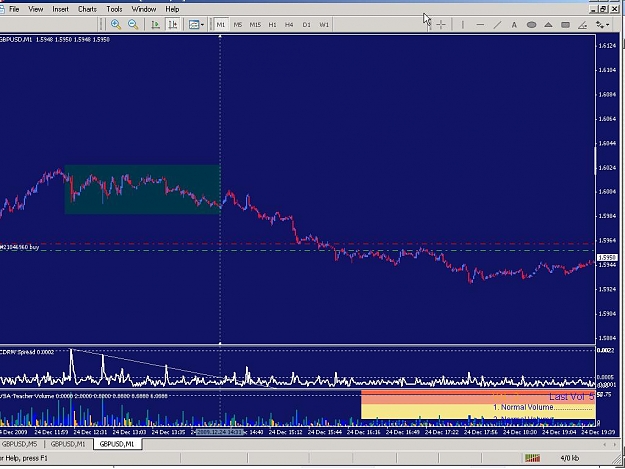
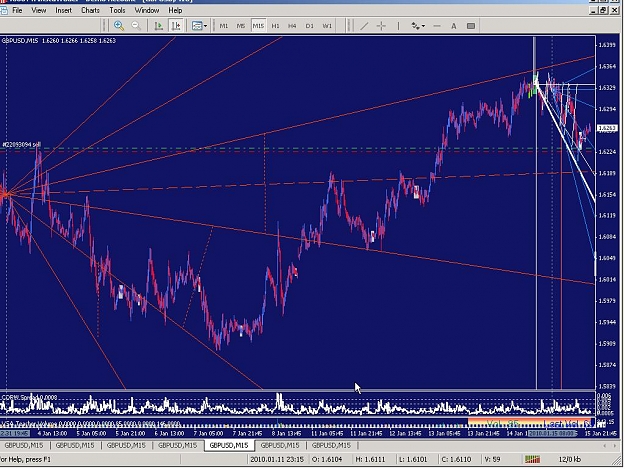
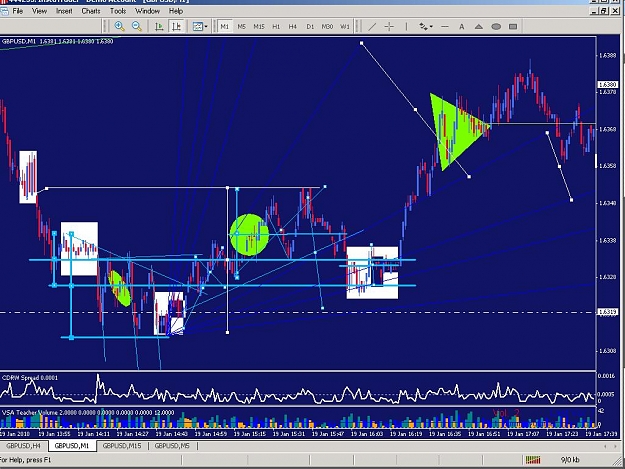
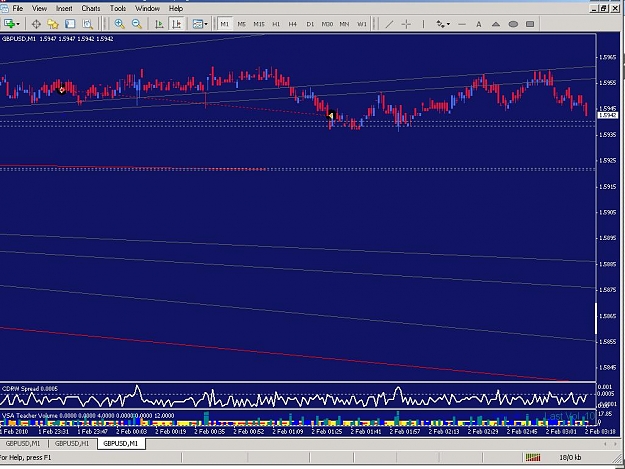
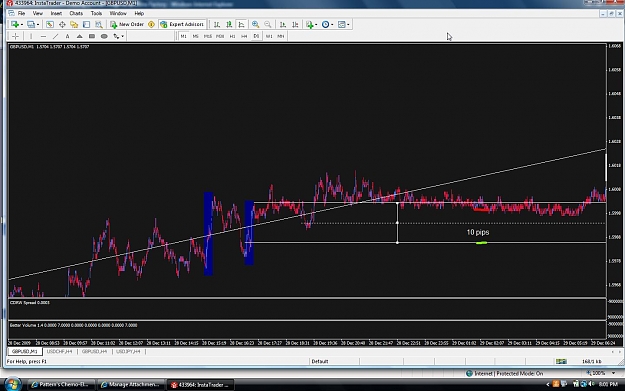
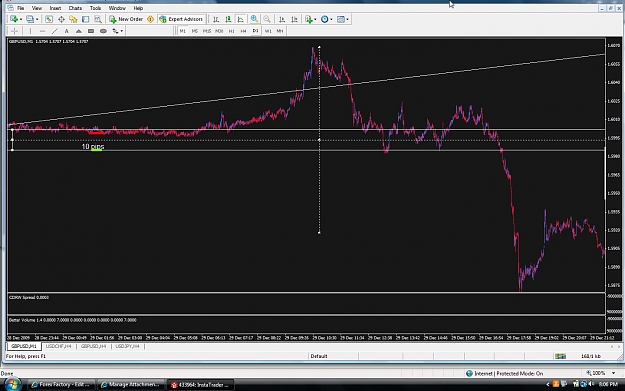
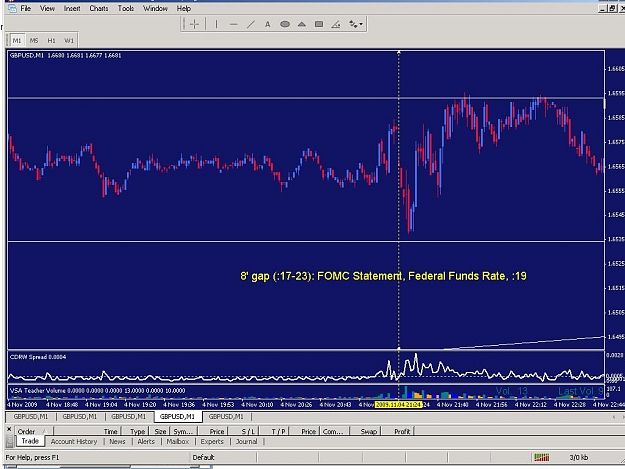
A kind programmer in my 'tick beat indicator' thread said that the gaps between prices on charts are due to the lack of ticks. They are also and, I would surmise, often due to the provider's data feed breaking down. The example below shows no trades were taken during the FOMC Statement / Federal Funds Rate news announcement on 11042009 at 2119 gmt+2:
-----
While looking around, found this neat page for daylight savings time around the world and for lots of years: http://wwp.greenwichmeantime.com/tim.../rules/usa.htm
Achieved about 10% each of yesterday and today, using the new hand-drawn same-spread bar channels approach to close-up work (found in 'balance lines' thread.) It was a fairly easy 24h, after the 30+ and the 50+ flattening the g/u into easy waves. That is, easy enough for a new approach like mine to stick to enough to get by with.
It's a good feeling surrounding and being fairly certain about, instead of taking pot shots at and getting what is then partially justifiably worked up over, the next price-time trend.
One basic mistake I made was on a good opportunity to explain the multiple trend with trend centerlines (in deep sky blue lines), here. Just including that concept regularly should help to develop it. Price seemed to jump above the (yellow-green rectangled) bunch.
Attached Image (click to enlarge)
-----
Also:
A kind programmer in my 'tick beat indicator' thread said that the gaps between prices on charts are due to the lack of ticks. They are also and, I would surmise, often due to the provider's data feed breaking down. The example below shows no trades were taken during the FOMC Statement / Federal Funds Rate news announcement on 11042009 at 2119 gmt+2:
Attached Image (click to enlarge)
-----
While looking around, found this neat page for daylight savings time around the world and for lots of years: http://wwp.greenwichmeantime.com/tim.../rules/usa.htm