Home
Search Forums
Keywords:
Search Titles Only
User Name:
Exact Match
Show Results As:
Advanced Options
Reply
 
Thread Tools Search this Thread
  #1  
Old Feb 5, 2007 3:45pm
hanover's Avatar
.
 
Member Since Sep 2006
Lightbulb FFcal - Plot News indicator

Oct 16, 2009:

Please note: V 1.37 of FFcal.EXE is the final version available to the public. I will no longer be supporting this product, or answering questions in this thread. Of course anybody is welcome to modify Plot_News.MQ4, or create an MQ5 version.

Plot News v2.0 is now available here.
________________________________

Hi everybody,

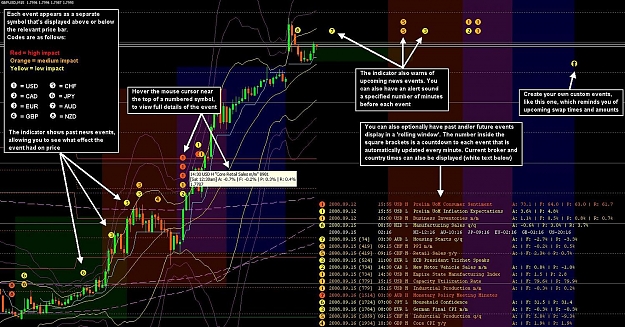
This is my best attempt to make the installation and use of the Plot_News indicator as user-friendly as possible. For those who are unfamiliar with the indicator, it displays news events as small numbered circles on your MT4 charts (see first screenshot below). Hover the mouse cursor over each circle to see details of the news event (see final screenshot below). Hence it is possible to see both (1) what effect each event had on price, historically; and (2) also be warned of upcoming announcements. All data is obtained from the FF calendar.

The product consists of two components: (1) the FFccstart.BAT application, which downloads news events from the FF calendar, creates its own (viewable) Events History database, and also a text file ("News.CSV") of news events; (2) the Plot_News.MQ4 indicator, which you attach to your MT4 charts: it reads News.CSV and plots the little numbered circles. See the "Process Overview" diagram below for detailed information.

From now onward, the latest version (currently v 1.37, uploaded July 16, 2009) will always be attached to this post (#1). Everything that's needed to make it work will be downloadable from the one ZIP file. (The software has undergone many changes over the months and the next 20 or so posts in this thread can be safely ignored.) The version number is displayed in the blue header of the main program window. Every time the program is updated, I wil increment the version number, and also add a new post to this thread, to bump it up the forum.

[NOTE: a simpler, and more automated, news plotting indicator is available here. Please note that I did not develop, nor do I support, this indicator. It is a completely separate product that plots only a subset of the current week's news, sourced from Dailyfx.com's calendar. Anybody who is seeking a more user-friendly, but less feature-rich, alternative might like to check it out. For yet another possible alternative, you might also like to try Derk Wehler's FF calendar indicator here]


Installation
[N.B. Before attempting to install the software, please read the legal Disclaimer below].

To install Plot_News, here is what you need to do:

1. Create a new folder, then download and unzip the attached ZIP file into it.

-- Note: If your IE downloaded ZIP file is corrupted... Many users report problems using Internet Explorer to download a complete ZIP file. Please use an alternate browser such as Mozilla Firefox or Opera.

-- To load the complete FF calendar (archive: Jan 1, 2006 thru Jan 30, 2009), see the "Calendar Archive" section below.

2. If you wish, create a shortcut or icon to run the application FFcstart.BAT (i.e. find the file showing as Name = FFcstart; Size = 1 KB; Type = MS-DOS Batch File; in Windows Explorer; then right click and select "Create Shortcut", and finally drag the shortcut onto your Windows Desktop).

3. Double click to run the application FFcstart.BAT.
New in version 1.24: The 'Initial Setup' screen will appear.
Enter the date/time in each of New York; your MT4 broker; and your local time, as instructed. See the help info displayed on the screen.
Then select the folder where your MT4 is installed from the dropdown.
Click OK to return to the 'Build News.CSV' screen.
See here for further instructions.

4. Then press ENTER (or click OK) to build the News Events History. The default settings will cause the most recent 4 weeks of news events to be loaded (including the current week). Hence the data collection window (black background) will appear, and then disappear, 4 times.
These news events will be displayed in a rolling table. Press Alt-F4 or click the close ('x') icon at the top right of the window to exit the application.

5. The above process should have automatically copied the files Plot_News.MQ4,EX4 and Plot_External_Data.MQ4,EX4 from your download folder into the folder crogram files<your MT4 broker name>expertsindicators
If these files dont exist there, or if you're running MT4 from anywhere other than crogram files..... then you will need to copy these files yourself.

6. Re-start MT4 and attach the Plot_News indicator onto your chart(s). To do this, press Ctrl-N to get the Navigator panel, open the "Custom Indicators" tree, and drag the Plot_News indicator onto the chart.


Operational Instructions

Whenever you want to update your MT4 charts with the latest data from the FF calendar, run the FFcstart.BAT application, and press ENTER. If the 'Auto set' option is checked ON, then the application will automatically keep its News Event History up to date, every time you run this. Otherwise you will need to advance the 'Download data from FF calendar starting from what date' parameter by 7 days, once every weekend, to add in the news events for the upcoming week.

After running FFcstart.BAT, you can change the parameters to select exactly which news events you want plotted on your MT4 charts. You can also change the symbols and their colors. Simply make the required changes, and press ENTER.

Press F9 if you want to see all of the news events that have been downloaded from the FF calendar.

Refer to the attached user manuals for more information.


New Features

Version 1.20:
This update modifies FFcal.EXE to make it compatible with the latest format changes to the FF calendar.

Version 1.21:
The Export (Backup) and Import (Restore) facilities have been added. It is now possible to make multiple CSV file backups of the data in your News Events history. Press Alt-F9 and follow the instructions on the screen.
For more information, see here

Version 1.22:
1. FF calendar ID code can now be downloaded and used.
2. Fixed bug relating to download of the week beginning July 15,2007.
Full details here

Version 1.23:
1. Bug fix.
2. 'Initial Setup' facility for new users.
3. Auto date set option.
Full details here

Version 1.24:
1. Enhanced user-friendliness of setup options.
Full details here

Version 1.25:
1. Additional exporting features, including the ability to export files suitable for use with the Plot_External_Data.MQ4 indicator.
2. The Plot_External_Data.MQ4 indicator, which allows economic indicators (from FFcal.EXE's Events History database) and other non-technical, or non-forex, indicators to be plotted on MT4 charts.
Full details here and here

Version 1.26:
1. Minor bug fix.
2. Added "Omit events with no ‘Actual’ value" parameter.
3. The "Show only events whose descriptions contain only" parameter has been extended.
4. A new "Preview" button, allowing export data to be previewed before it is output.
5. A new "Plot_News format" button, which automatically resets parameters to their original state.
6. A new ">>>" button that allows you to run exports for all (or selected groups of) profiles simultaneously.
Full details and instructions here
Fully annotated exmaple here

Version 1.27:
1. Minor bug fix.
2. New buttons in the "Color for Impact levels" area.
3. New sort option tabs on the "Export Preview" facility.
4. Major new feature: "Effect Analysis" reporting.
Full details and instructions here

Version 1.28:
1. Minor bug, and process streamlining, fixes.
Full details and instructions here

NEW: Alert_News.MQ4 indicator
This "sister" indicator to Plot_News will display/sound an Alert X minutes before each news event occurs (where you supply a value for X).
The latest version is included in the ZIP file attached to this post.
For operational instructions, see here

Version 1.29:
1. Minor bug, and process streamlining, fixes.
Full details and instructions here

Version 1.31: (NB: there is no version 1.30)
1. FFcal.EXE app starts maximized, and with a splash screen.
2. All windows are now resizable.
3. An automatic backup of Events History database (to file @BACKUP@.CSV) occurs every time an output/export is performed.
4. Alt-F9 facility (Delete/Rebuild/Import/Export) now calls Events History database view automatically upon completion.
5. Separate symbols for positive and negative swap now supported.
6. Events History database files no longer overwrite your existing database, upon installing new version (removes need for Backup/Restore, for existing users).
7. Lowercase characters may no longer be typed into the export filename field.
Full details and instructions here

Version 1.31a:
There are no changes to either Plot_News.MQ4 or FFcal.EXE in this release.

However, the ZIP file now includes a folder "Third party products (not supported by Hanover)" which contains:

-- Pips4Life's version of Plot_News.MQ4 - see here for more information.
-- SpinDrift's version of Plot_News.MQ4 - see here for more information.
-- Monzulu's amended Wingdings font - see here for more information.

Version 1.31b:
Version 1.31b contains a new version of Plot_News.MQ4, that allows news to be printed as text instead of, or in addition to, the numbered symbols.
It also includes a RefreshEveryTick option, which, if set to TRUE, eliminates the need to regularly resfresh the indicator by editing it.
See here for more information.

Version 1.31c:
Version 1.31c makes further enhancements to Plot_News.MQ4:
-- facility to show current broker time, and also times in New York (USD), Toronto (CAD), London (GBP) , Geneva (EUR, CHF), Tokyo (JPY), Sydney (AUD) and Auckland (NZD).
-- Alerts facility: will now sound/dsiplay Alert before each news event (i.e. includes function in Alert_News.MQ4)
-- now refreshes indicator every minute (instead of every tick), reducing CPU overhead and possibility of inter-program conflict
-- Pips4Life's weekly reminder has been included
See here for more information.

Version 1.32:
1. HTML entities &...; are now converted to MT4-intelligible characters.
2. New checkbox allows local date/time to be output to export files (instead of MT4 broker date/time).
3. Included an updated version of the "Plot_News - getting started instructions" XLS in the attachments at the foot of this post.
4. The @FFCALR@.ZIP archive file included in the install ZIP now contains all news events from 1/1/2006 thru 1/30/2009.
Full details and instructions here

Version 1.32a:
1. Bug with times for 'Up Next' news events is now fixed.
2. 'White flag' events like Bank Holidays can now be imported as low impact news events.
Full details and instructions here

Version 1.33:
1. Can now press F10 key to process News.CSV data.
2. News Composite (NCI) export is now included. The NCI indicator can be found here.
Full details and instructions here

Version 1.34:
1. Fixes bug where object name/dsecription output to MT4 exceeds 62 bytes.
Full details and instructions here

Version 1.35:
1. Fixes bug that caused error "Open(calend~1.php) - File Not Found".
Full details and instructions here

Version 1.37:
1. Allows downloading, filtering, plotting, exporting etc of Chinese CNY news events.
Full details and instructions here


Calendar Archive

The @FFCALR.CSV@ file in the ZIP file below contains a complete archive of the FF calendar (9,314 news events) from 1/1/2006 thru 01/30/2009.

The CSV file can be loaded directly into Microsoft Excel, and/or be edited using a text editor.

The dates/times of news events are Alpari time (currently GMT+1). If you are planning on using these in Plot_News, you will need to modify these news event times to those of your MT4 broker, including all necessary adjustments for Daylight Saving time.

To import the CSV file, in full or in part, into Plot_News' Event History database, proceed as follows:

1. Run FFcstart.BAT, and press Esc, then Alt-F9.

2. Choose the "Delete and then Import (i.e. Restore)" option.

-- Enter the desired date range (format: MM/DD/YYYY). Make absolutely certain that you have this correct, as it will delete all news events in your existing Event History database, and replace them with those, that fall within the same date range, from the import file.

-- Set the "Name of Import / Export file" to FFCALR

-- Click OK. Verify that the events have been imported correctly into the Events History database.

Note that you can re-run this process (press Esc, then Alt-F9 again), and choose the Rebuild option, to adjust the news event times back or forward any number of hours, for all events within your specified date range.

UPDATE (July 4,2009): See here for a ZIP containing the full FF calendar of news events dated between Jan 1,2007 and July 3,2009, in CSV format, with all events time-stamped with New York date/time. News events for 2006 are no longer available from FF calendar. The CSV file contains all 9,711 entries in FF calendar up to July 3, 2009.


FAQ / "How to...." hints

You can study the month-to-month variations in any particular news event.
More information here

You can use FFcal.EXE to export the FF calendar to XML, CSV, and columnar formats.
More information here

You can press Alt-F9 to modify subsets of news events in FFcal.EXE's History database:
  • Delete multiple news events from the database
  • Rebuild multiple news events, changing their times (useful for converting to a different timezone, or adjusting for daylight saving)
  • Export subsets of news events, or backup the entire database
  • Import subsets of news events, or restore the entire database from a prior backup
More information here

You can plot economic indicators (from FFcal.EXE's Events History database) and other non-technical, or non-forex, indicators on your MT4 charts.
More information here and here
Fully annotated examples here and here

You can export data to an XLS, showing in tablular form, the effect that any prior news annnoucement(s) had on price, across time intervals of your choice.
More information here

You can also have your own custom designed (non-FF calendar sourced) events plot on your MT4 charts.
Instructions here.


Troubleshooting / Error Recovery Procedure

The following are known error messages. In each case, you will need to click the ABORT button, and then close and re-start FFcstart.BAT/FFcal.EXE.

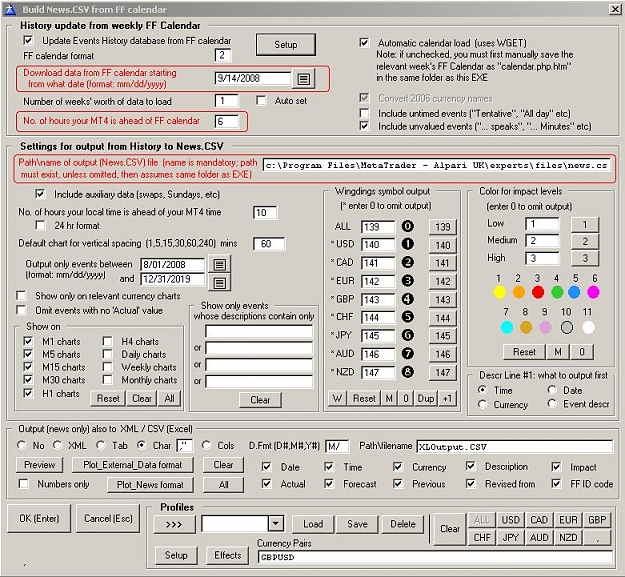
-- "Access denied" : most likely caused by either (1) failure to specify a file name in the "Pathname of output (News.CSV) file....." parameter (see second screenshot below); or (2) this file is already open and in use by another application. Make sure that you have specified a valid filename at the end of the path (preferably news.csv), and/or close any other application that might be accessing this file.
This can also occur if the Plot_News parameter AutoRefresh = true while FFcal.EXE is running, because both applications are attempting to access the News.CSV file simultaneously. Either (i) set AutoRefresh to false, or (ii) run FFcal.EXE again, and hope that the process completes between ticks.

-- "Creates duplicate key" : the database has become damaged (it is trying to add a news event with the same date/time, currency pair, and description, a second time). Close the application and perform the 'last resort' solution below.

-- "File not found - calend~1.php" : this is a strange and infrequent error, reported by only a few users, and may relate to your version of Windows being unable to 'see' 8-character filenames (the old 'DOS' format). Try changing the date in the "Download data from FF calendar starting from what date" parameter (see second screenshot below). Failing that, close the application and perform the 'last resort' solution below. It is possible that there may be no solution short of your changing your version of Windows. Despite trying everything that I know, I have not been able to reproduce this error on either of my Win-98 and Win-XP platforms. NOTE: this error has (hopefully) been eliminated in v 1.35

-- "Path not found" : most likely caused by an incorrect path name in the "Pathname of output (News.CSV) file....." parameter (see second screenshot below). This path must already exist. Check your spelling, punctuation, number of spaces, etc – all must be 100% correct (Windows is very fussy). However, capitals or lower case doesn't matter.


The 'Last Resort' Solution

The FFcstart.BAT/FFcal.EXE application has been running for several months now and is supposedly very stable.
However, if you are experiencing recurring errors, the best 'last resort' solution may be to clear out the Events History database, and start over. Here's how:

1. Run My Computer/Windows Explorer (or whatever file manager you use), and go to the folder where you originally unzipped Plot_News. There should be files there named:
CALENDAR.DAT
CALENDAR.K01
CALENDAR.K02
CALENDAR.K03

These are the files where the Events History are stored. Delete these four files. That should hopefully reset everything.

2. Run FFcstart.BAT. Press Esc, then Alt-F9. Select the "Delete and then Import (i.e. Restore)" option. Make sure that the "Name of Import/Export file" is set to BACKUP, then click OK to restore your entire News Event History database.

______________________

Disclaimer

This software is offered, free of charge, on an "as is" basis, with no guarantee of correct operation, or support. My PC config allows testing on Win-98 and Win-XP Pro only. While I have firewalls and anti-virus operating on my PCs, by downloading and running the software, you agree to do so AT YOUR OWN RISK. I accept NO LIABILITY WHATSOEVER for any losses or damage.

This software is intended for use as a tool only. If/how you decide to use it to assist with your trading decisions, that is entirely your choice. I accept NO LIABILITY WHATSOEVER for any trading losses that you might incur.

______________________

Please feel welcome to post queries and suggestions, and report errors, in this thread.

When I have time, I will update the operations manuals. In the meantime, you can download the most recent versions (the Word docs) that are attached below.

Good luck with your trading!

Best wishes,
David
______________________

Other FREE indicators by Hanover:

News Composite Indicator (NCI)
Candle Identifier indicator
Recent Candles indicator
Recent Strength indicator
Recent Prices indicator
Attached Thumbnails
Click image for larger version

Name:	plotnews help1.jpg
Views:	3611
Size:	246.0 KB
ID:	148101     Click image for larger version

Name:	plotnews help2.JPG
Views:	891
Size:	146.5 KB
ID:	148102    
Attached Images
 
Attached Files
File Type: doc FF calendar converter - instructions.doc (612.0 KB, 4521 views)
File Type: doc Plot_News indicator - instructions.doc (521.5 KB, 5132 views)
File Type: xls Plot_News - getting started instructions.xls (338.5 KB, 1811 views)
File Type: zip FFcal137.ZIP (1.12 MB, 2282 views)

Last edited by hanover, Nov 15, 2009 6:23pm Reason: Version 1.37 update
Reply With Quote
  #2  
Old Feb 5, 2007 3:52pm
Member
 
Member Since May 2006
Default

Nice work....
Reply With Quote
  #3  
Old Feb 5, 2007 4:35pm
hanover's Avatar
.
 
Member Since Sep 2006
Default Screenshot

Quote:
Originally Posted by merlin View Post
mind posting some screenshots for the MT impared?
In the attched ZIP is a screenshot showing both the Sessions and Plot_News indicators operating together.

Note how Plot_News plots the circular symbols both in the past, and future.

If you hover the mouse cursor over any news symbol, something like the following appears:
22:30 AUD L "Manufacturing PMI"
Actual: 52.4 Forecast: Previous: 54.4
1.8854
i.e. showing the time, currency, impact, description and also Actual, Forecast and Previous values, where these are available. But of course it's not possible to show this in the screenshot.

David
Attached Files
File Type: zip chart04.zip (50.3 KB, 2547 views)
Reply With Quote
  #4  
Old Feb 5, 2007 6:42pm
hanover's Avatar
.
 
Member Since Sep 2006
Default Timezone adjustment solution

The attached ZIP contains an updated version of FF_calendar_converter.XLS that adjusts the time entries for you, if the time scale (horizontal axis) in your MT4 charts is not GMT/UTC based.

Simply enter in the timezone offset, in hours, into cell O1 (green background). For example, if your MT4 horizontal axis is based on New York EST, which is GMT–5 hours, enter –5 into this cell. Then you should see all of the times in the news announcements text (column U) automatically adjust themselves by 5 hours.

Then output the data in column U to News.CSV as explained in my prior post (#1 in this thread).


To summarize post #1 (for those who don't like reading long-winded instructions), the only two files you need are:

News.CSV
in folder ...\metatrader 4\experts\files
Plot_News.EX4 in folder ...\metatrader 4\experts\indicators

Then attach the Plot_News indicator to your chart, in the usual manner.

David

PS: et_phonehome_2, thanks for the feedback.
Attached Files
File Type: zip FF calendar converter.zip (66.4 KB, 2218 views)
Reply With Quote
  #5  
Old Feb 5, 2007 7:23pm
hanover's Avatar
.
 
Member Since Sep 2006
Default Duplicate object names solution

I believe I’ve fixed the bug I mentioned in the ‘STOP PRESS’ section in post #1.

It seems that MT4 disallows duplicate object names, hence when the “Unemployment Claims” event comes out at the same time every week, only the first of these was being plotted.

To remedy this, I’ve attached a unique serial number to the end of the object name (i.e. first description line). When reading the chart it can be ignored. The example in post #1 now looks like:
22:30 AUD L "Manufacturing PMI" 347
Actual: 52.4 Forecast: Previous: 54.4
1.8854
where 347 is the serial number.

As far as I can tell, the Plot_News indicator is now working 100% as intended. But I will continue testing.

The attached ZIP contains the latest versions of all relevant files, and supersedes all previous attachments. All of the operating instructions remain unchanged.

David
Attached Files
File Type: zip Plot_News indicator.zip (96.8 KB, 2340 views)
Reply With Quote
  #6  
Old Feb 5, 2007 7:38pm
Member
 
Member Since Nov 2006
Default

Brilliant idea and nicely put together.


Reply With Quote
  #7  
Old Feb 6, 2007 5:23pm
hanover's Avatar
.
 
Member Since Sep 2006
Default

Quote:
Originally Posted by adam141 View Post
Brilliant idea and nicely put together.
Adam141, many thanks for the feedback.

Best wishes
David
Reply With Quote
  #8  
Old Feb 6, 2007 11:20pm
C.E.O.'s Avatar
WTF!
 
Member Since Dec 2006
Default

Good stuff.
See this post for an idea on how to get the info into the csv.
http://www.forexfactory.com/showthre...highlight=wget
Reply With Quote
  #9  
Old Feb 11, 2007 5:52pm
hanover's Avatar
.
 
Member Since Sep 2006
Default Update to News.CSV file for week beginning Sunday Feb 11

The attached ZIP contains the latest News.CSV and Plot_News.MQ4 files. News.CSV contains updates to last week's "Actual" values, and all FF calendar values for the upcoming week. I have waited for the "Forecast" column of the FF calendar to be populated before posting these.

You can use any text editor to add all of your own entries to News.CSV, to suit your own requirements, provided that you follow the format described in post #1. As an example, I have added the Rollover (swap) times for each day in the upcoming week (eight-sided star symbol), and also an end of week symbol (four diamonds), in case I want to close trades before the weekend. These appear at the start of the file; you can delete them if you wish.

You can modify the symbols to any in the Wingdings character set (table in attached ZIP).
I’ve also added some more popular and distinctive colors, as follows:

1 = Yellow (denotes low impact announcement)
2 = Orange (denotes medium impact announcement)
3 = Red (denotes high impact announcement)
4 = (Lime) Green
5 = (Dodger) Blue
6 = Magenta
7 = Aqua
8 = Brown (Goldenrod)
9 = Purple (Plum)
0 = Silver


So now it’s possible to customize both symbols and colors, however you wish.
Programmers can of course further modify the MQ4 to suit.

For detailed instructions, refer back to post #1.

David
Attached Files
File Type: zip Plot_News.zip (46.6 KB, 1317 views)
Reply With Quote
  #10  
Old Feb 17, 2007 3:32am
hanover's Avatar
.
 
Member Since Sep 2006
Default Version 2, plus news events for the coming week

The attached ZIP includes Version 2.0 of Plot_News indicator, and News.CSV. [Note: these override files attached in all prior posts in this thread]

News.CSV has been updated to reflect all "Actual" announcement values for events up to Sat Feb 17, and will also cause objects to be placed for all news events currently listed on the FF calendar, and rollover times, for the coming week (Feb 18-24).

Changes to latest version are described in red typeface below.


Changes to displayed objects/symbols

a) The rollover symbols now show positive and negative swap carry values (for each lot, based on Interbank FX's rates) in the second description line of the help panel.

b) You can now have local time displayed in the second description line (see "Local time" parameter in the FF_calendar_converter.XLS section below).


Changes to indicator parameters

VertSpacing: entering a negative number (<0) now causes the objects/symbols to be displayed ABOVE the prices on the chart. The absolute value of the number controls the spacing between symbols.

SymbolSize: allows you to change the size of the objects/symbols (valid values are 1=smallest thru 5=biggest). Default is 2 which leaves sizes unchanged from previous version.

Other parameters remain unchanged, and operate exactly as before.


Fields in News.CSV

These are now as follows:

Field #1 = Event date and time, which controls the horizontal position on which the graphic will be plotted on the chart. Must exist the form yyyy.mm.dd<space>hh:mm

Field #2 = Event counter, which controls the vertical position of the plot, so that where multiple announcements occur at the same time, the graphics are plotted above/below each other. The first event at a given time is 1, the second is 2, and so on.

Field #3 = The wingdings character (ASCII code) corresponding to the implicated currency.

Field #4 = The impact number that will determine the color of the object:
1 = Yellow = low impact
2 = Orange = medium impact
3 = Red = high impact
4 = (Lime) Green
5 = (Dodger) Blue
6 = Magenta
7 = Aqua
8 = Brown (Goldenrod)
9 = Purple (Plum)
0 = Silver

Field #5 = Currency filtering.
ALL = show object/symbol in all currency charts
XXX = show object/symbol on charts only where XXX is one of the currencies in the pair
XXXYYY = show object/symbol only on charts for the currency pair XXXYYY
(Valid values for XXX and YYY are USD, CAD, EUR, GBP, CHF, JPY, AUD, NZD)
Note that the indicator parameter filters continue to operate exactly as before, i.e. matching the TRUE/FALSE entry alongside the appropriate wingding character in Field #3.

Field #6 = The text that will appear in the first line of the rectangular help panel. This is the name of the object in MT4.

Field #7 = The text that will appear in the second line of the rectangular help panel


Changes in FF_calendar_converter.XLS

Parameters (in cells F2 thru F5, yellow background):

MT4 time: offset from FF calendar (hours)
Enter time differential (in hours, if any) between FF calendar and MT4 horizontal axis value, e.g.
(1) if MT4 is 13 hours AHEAD of your FF calendar setting, enter +13
(2) if MT4 is 6 hours BEHIND your FF calendar setting, enter –6

Local time: offset from FF calendar (hours)
Works the same as the previous entry, and causes an (e.g. [Mon 12:50]) message to display on the second description line, where this is your local time. If your entry here is the same as for the previous entry (i.e. local time is the same as MT4 time), then obviously there's no need for local time to be displayed separately, hence it is omitted.

"Show news event only for related currencies (0=no, 1=yes)"
1=yes: will cause the impacted currency for each event to be repeated in Field #5 of the output, hence the news events will only display on charts pertaining for that currency,
e.g. if the event is USD Non-farm payrolls, then the object for this event will only display on charts where USD is one of the currencies in the pair (GBPUSD, USDJPY, etc)

0=no: will cause symbols/objects to display on the charts for all currencies, by outputting "ALL" in field #5 for every news event. (This is the way it operated in the previous version).

Target chart timeframe (mins)
This controls the entries that are automatically output in Field #2. For example, entering 30 means that Field #2 gets incremented for each duplicate event within the same 30 minute period (e.g. 11:00 thru 11:29), which means that symbols/objects will be spaced without overlapping vertically for all time frames 30 minutes and below.
e.g. if there are news events at 11:30 and 11:45, then an entry >15 would be necessary to stop these objects from overlapping each other on timeframes longer than M15.

Valid entries are 1, 5, 15, 30, 60, 240, 1440 (for M1, M5, M15, M30, H1, H4, D1, respectively)


As before, copy relevant rows (news events) from column AC into News.CSV, delete blank lines in the latter, and save it in folder C:\Program Files\MetaTrader 4\experts\files

See post #1 in this thread for more details.


Installation Notes

As before, unzip:

a) News.CSV into folder C:\Program Files\MetaTrader 4\experts\files

b) Plot_News.MQ4 and Plot_News.EX4 into folder C:\Program Files\MetaTrader 4\experts\indicators


David
Attached Files
File Type: zip Plot_News.ZIP (263.4 KB, 1659 views)

Last edited by hanover, Feb 17, 2007 7:43pm
Reply With Quote
  #11  
Old Feb 24, 2007 6:44am
hanover's Avatar
.
 
Member Since Sep 2006
Default News.CSV for upcoming week

In the attached ZIP file, News.CSV has been updated to reflect all "Actual" announcement values for events up to Sat Feb 24, and will also cause objects to be placed for all news events currently listed on the FF calendar, and rollover times, for the coming week (Feb 25 thru March 3). E&OE.

There are no software nor operational changes. The latest Plot_News.MQ4/EX4 files can be downloaded from the previous post (#14). Installation and usage notes can be found there also.

Cheers
David
Attached Files
File Type: zip Plot_News.ZIP (312.6 KB, 1347 views)
Reply With Quote
  #12  
Old Feb 24, 2007 3:45pm
hanover's Avatar
.
 
Member Since Sep 2006
Default I'm baling out

This is just to let everybody know that I will no longer be keeping this data up to date. I've decided to end my interest in analysis and trading, in order to get on with my life.

The MQ4, XLS, and CSV files are all here for anybody who wants to pursue this further.

David
Reply With Quote
  #13  
Old Apr 27, 2007 5:23pm
hanover's Avatar
.
 
Member Since Sep 2006
Default Plot_News indicator

Hi all

My health has improved, and I will try to keep this alive and up-to-date again for as long as I can, for anybody who is still interested. I see, from Merlin’s post above, that there is now another news plotting indicator.

In the post(s) following this one I will attach the latest MQ4, EX4 and News.CSV files. As before, the latter needs to be downloaded into the folder: C:\Program Files\MetaTrader 4\experts\files\

The current News.CSV file plots both previous (back to 1 Jan 2007) and upcoming news, so you can both
(i) easily see the historical effect news had on prices; and also
(ii) prepare your trading strategy to cope with impending announcements.


News.CSV file

The latest format of the News.CSV file consists of three sections:

1. Rollover times and rates for the current or upcoming week: these will display a yellow asterisk for single rollover, and a red asterisk for triple rollover, underneath the relevant price bar. Hovering the mouse cursor over the asterisk displays the buy and sell swap rates (in USD per lot). This allows you to quickly see how favorably, or otherwise, rollover would affect your current trade.

2. Sundays since 1 Jan 2007: these display an “X” symbol on the D1 charts to highlight days (Sunday) where the market is not open for the full 24 hours.

3. News announcements since 1 Jan 2007, sourced from the FF calendar. These work the same as described earlier, i.e. red, orange and yellow numbered circles for high, medium and low impact announcements, respectively. The number inside the circle denotes the relevant currency:
0=ALL, 1=USD, 2=CAD, 3=EUR, 4=GBP, 5=CHF, 6=JPY, 7=AUD, 8=NZD
Hovering the mouse cursor over the circle works as described previously, giving a full description of the announcement, and the actual, forecast and previous values. Note: I have set the [timeframes] entry (explained below) so that news announcements are plotted only on the H1 and lower charts.

You can use a text editor to delete any sections, or individual lines, in the file, that don’t suit your requirements. Each line corresponds to one symbol that will be plotted on the chart.


Format of text lines in News.CSV file

You can also add or modify lines to suit, but these must exist in the following format:
[date time];[spacing];[symbol];[impact];[currency];[timeframes];[text1];[text2]

Examples:

2007.04.23 22:00;1;174;1;EURUSD;111111000;22:0 0 EURUSD L "Rollover" 10;[Tue 10:00] buy: (6.05) SELL: 5.40

2007.04.22 23:00;1;120;2;ALL;000000100;23:00 ALL M "Sunday" 124;[Mon 11:00]

2007.04.24 23:50;1;145;1;ALL;111110000;23:50 JPY L "Trade Balance (p)" 1148;[Wed 11:50] Act: 1.63T F'cast: 1.35T Prev: 0.98T

2007.04.25 18:00;1;140;2;ALL;111110000;18:00 USD M "Beige Book" 1158;[Thu 06:00]

2007.04.25 21:00;1;147;3;ALL;111110000;21:00 NZD H "Interest Rate Statement" 1159;[Thu 09:00] Act: 7.75% F'cast: 7.5% Prev: 7.5%

Note that all semi-colons must be included, even if an entry is blank. The individual entries must meet the following criteria:

[date time] is the date/time of the event. Format must include a single space between date and time, thus: yyyy.mm.dd hh:mm

[spacing] determines where the symbol will display vertically on the chart. Valid values are integers from 1 upward. Where two or more events will occur during the same 15 (or 30, or 60, etc) minute interval, you can set their respective spacing to 1, 2, 3, etc so that they don’t overprint each other on the chart.

[symbol] is the number of the Windings character code to be displayed. For a table, see http://www.karbosguide.com/hardware/module1b.htm
(increase the text size in your web browser to see the symbols)

[impact] determines the color of the symbol. Valid values:
0 = white
1 = yellow (low impact)
2 = orange (medium impact)
3 = red (high impact)
4 = green
5 = blue
6 = magenta
7 = aqua
8 = brown
9 = purple
10 = silver gray

[currency] determines which currency charts the symbol will be displayed on. Valid values:
ALL = all charts
XXX = only charts where XXX (e.g. USD) is either one of the currencies in the pair (e.g. USDJPY or EURUSD)
XXXYYY = only currency pair XXXYYY (e.g. GBPUSD)

[timeframes] is a binary string, exactly 9 characters long, that determines which timeframes the symbol will be displayed on. Valid values: a ‘1’ means the symbol will be displayed; a ‘0’ means not. The position in the string determines which timeframe, from left to right these are M1, M5, M15, M30, H1, H4, D1, W1, MN. Example: 001110000 means that the symbol will be displayed on the M15, M30 and H1 charts only.

[text1] the first (upper) description line that displays when the mouse cursor is hovered over the symbol. It must be unique, i.e. no two lines in the file may be identical. This is generally of the form: [time] [currency] [impact] [description] [unique ID#]

[text2] the second (lower) description line that displays when the mouse cursor is hovered over the symbol. For news announcements, this is generally of the form: [local time] [actual value] [forecast value] [previous value], while for rollover events, this displays the swap rates. Local time is currently set to New Zealand time, but can be changed to suit.

In reality, [text1] and [text2] can contain any text you wish, provided that [text1] is unique.

You can add new lines to the News.CSV file to have Plot_News display whatever symbols you want, in whatever colors, on charts for any desired currency or timeframe.


Plot_News indicator parameters

These are the same as before, thus:

FileName – change from News.CSV to whatever you wish. The file must exist in folder C:\Program Files\MetaTrader 4\experts\files\

VertSpacing – default is 5 (pips). Increasing this value causes wider vertical spacing between symbols being plotted below the same bar. Making the value negative (e.g. –5) causes the symbols to be plotted above the bar, instead of below.

Symbol Size – a value between 1 and 5, determining the size of all symbols being plotted. Default value is 2.

FromDate, ThruDate – only events falling inside this date/time range will be plotted. Defaults are 01-Jan-1990 and 31-Dec-2009, allowing all news to be plotted.

Plot_USD, CAD, EUR, GBP, CHF, JPY, AUD, NZD – set to FALSE to stop events pertaining to a currency from being plotted. Note that this is based around the Wingdings [symbol] entry, i.e. operates completely independently of the [currency] entry in News.CSV

Plot_High, Plot_Medium, Plot_Low – set to FALSE to stop events pertaining to the relevant impact from being plotted.


Re-plotting the Plot_News indicator

The plotted symbols can become displaced, when changing timeframe or the chart zoom. To re-plot correctly, simply edit the indicator, leaving the parameters unchanged (hotkey sequence is: Ctrl-I; press P as many times as required to select Plot_news; Alt-E; Enter; Enter).

The same also applies if you change the News.CSV file on the fly. To re-load the latest changes, simply edit the Plot_News indicator.


Cheers
David

Last edited by hanover, Apr 27, 2007 6:08pm
Reply With Quote
  #14  
Old Apr 27, 2007 6:51pm
hanover's Avatar
.
 
Member Since Sep 2006
Default Attached: News.CSV 1 Jan 2007 thru 5 May 2007

The attached ZIP file contains the following:

plot_news.gif: a screenshot of an MT4 chart showing the Plot_News and Sessions indicators. Of course it’s not possible to show how the full event description, actual, forecast and previous values are displayed while the mouse cursor hovers over the relevant numbered circle(s). The Sessions indicator is not my own creation, and is not a prerequisite to running plot_news, but I find it to be a useful adjunct. The Asian, European and North American sessions are shown in green, purple and blue respectively, and the boxes heightened to show the highest and lowest prices attained during each session.

plot_news and sessions mq4/ex4 files: the latest versions. As usual, download these to C:\Program Files\MetaTrader 4\experts\indicators

news.csv: updated, as described in my previous post, to contain upcoming rollovers, prior Sundays, historical news announcements back to 1 Jan 2007, and up to the end of the upcoming week (Saturday 5 May). Must be downloaded to C:\Program Files\MetaTrader 4\experts\files

ff calendar converter.xls: for reasonably experienced Excel users, who want to maintain their own news.csv, this offers significant automation. Sorry, no instructions are included, but feel welcome to post questions in this thread.

For those who want a quick install, all you need to do is download plot_news.ex4 and news.csv to the correct folders, and then attach the plot_news indicator to your MT4 chart.

David
Attached Files
File Type: zip plot_news.ZIP (599.2 KB, 1060 views)
Reply With Quote
  #15  
Old Apr 28, 2007 8:53am
melpheos's Avatar
Stochastic pipster
 
Member Since Jan 2007
Default

I like this a lot... The FF calendar and burger calendar are great but they clog the view of the chart by adding a lot of text... I'm going to test this one right now

edit : i saw on one of your screenshot that you use boxingislife strategy
Reply With Quote
Reply

2 Traders Viewing This Thread (1 member)
profitideal
Thread Tools Search this Thread
Search this Thread:

Advanced Search


Similar Threads
Thread Thread Starter Forum Replies Last Post
Plot News (version 2.0) hanover Platform Tech 103 Aug 13, 2010 5:08pm
fractals indicator with maximum fractal number to plot pbb Platform Tech 2 Jul 3, 2010 5:22am
How to plot on indicator over another TakedaSh Platform Tech 3 Apr 27, 2010 3:42pm
Plot on graph - Indicator help hekenberg Platform Tech 2 Aug 21, 2008 1:07am
Indicator to plot lines for multiples of 10 within last days range bluefrog Platform Tech 2 May 10, 2008 10:04am