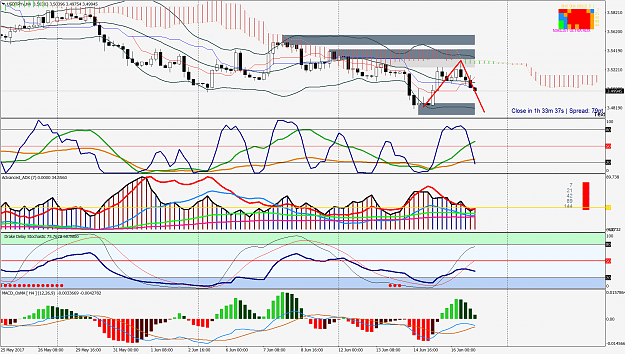
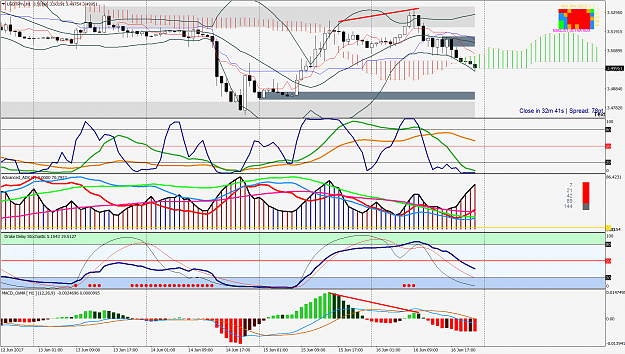
Disliked{quote} in the below example the corrections are marked by rectangle generally in price charts there are two moves always an impulse and a correction an impulse is a sharp long move that moves upwards or downwards within a short time a correction is a slow sideways move that takes too long going nowhere So these corrections have different patterns and this is where most people lose money if not understood any questions are welcome {image}Ignored
ok , thanks for the reply... i will read some articles about this to get more knowledge.
regards!!