It's important to understand why we at Jenkins Risk Management use an approach to trading that values the importance of understanding TIME and cycles as a prerequisite to learning about price action and any type of trend analysis. Technical analysis covers price action and trend, but it is in the field of cyclical analysis that we begin to advance into the understanding of not just space but space & time. We view space as the area of price action on the chart - the distance of highs and lows relative to each other. But when we begin to understand the aspects of TIME relative to a markets price action, then we begin to discover the keys to market timing and one increases their probability of picking specific highs and lows within the trend. We also begin to increase the probabilities of recognizing potential trend changes and it is this understanding of cycles and TIME analysis that we begin to properly anticipate the beginning and ends of a move and one will naturally then begin to achieve much higher success rates in ones trading.
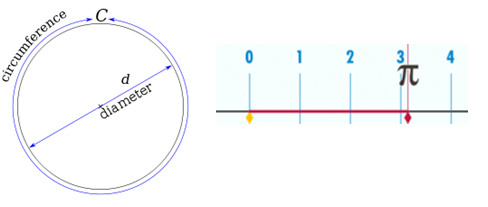
Let's begin with an understanding of a few basic concepts surrounding time and cycles, and how we use these cyclical approaches in our trading to produce high probable market setups. One of the core concepts in my trading model is what I call the Pi Line. Pi is the ratio of the circumference of a circle to its diameter, and Pis mathematical significance is well known throughout many fields and its origins go back to antiquity.
Pi has been represented by the Greek letter π, and because its definition relates to the circle, π is found in many formulas in geometry and trigonometry.
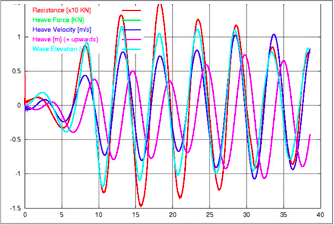
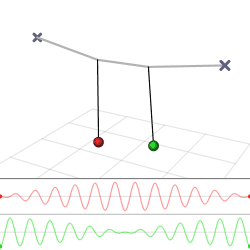
Pi appears in other sciences such as number theory and statistics, as well as it is found in thermodynamics, mechanics, and electromagnetism. We can also see the numerical significance of Pi in cyclical wave structures, sine and cosine functions repeat with a period of 2 π this oscillation and wave form creates a rhythm of time. It is these oscillations and wave formations that we try to identify in our trading. Much like the rhythm of a pendulum, we look to trade around the same rhythms of time on the chart.
It is this oscillation through time that creates this cyclical rhythm and these mathematical constants show that there is an underlying structure and geometry of not just space but also TIME. In this next section lets examine what I call in my proprietary trading model the Jenkins Pi Line concept.
Section 1: The Jenkins Pi Line
The price action on a chart is simply energy moving through people in what we call the markets. Everything moves in waves - it's how energy travels. This is why we built our model around such wave formation cyclical vibration. Pi defines the circle and thus it is the perfect cycle, this is why I originally began to search for ways to incorporate this cyclical and mathematical phenomenon in our trading model. What I discovered next was really a very simple basic discovery but one that produces amazing results on the price charts on all timeframes.
I decided to put Pi on the chart. I was looking for a longer moving average to incorporate into our trend analysis and decided why not take Pi 3.14 x100 and put a 314 simple period moving average on our chart. When I did, I was astonished at the accuracy and the frequency in which price made prominent highs and lows putting in tops and bottoms often times to the exact level as the moving average line itself. The incredible number of failures and bounces off this line was outstanding and it happens regardless of the time frame. I knew in my 15 years of trading and all my institutional experience talking to some of the largest and most well respected traders that I had never heard of anyone using such a moving average. Its fair to say that most traders never even go out past the well used 200 period moving average. So, I knew the idea of a self fulfilling prophecy with everyone using the same 314 period moving average was not a contributing factor as to why this average was doing such a spectacular job at defining price action. There was clearly more to why this moving average line worked so well. This was and is clearly proof of an underlying cyclical structure to how energy moves.
In our JRM Trading Model we do not use any one particular moving average nor do we use simplistic moving average crosses to determine when we buy and sell. Our model is much more complicated than such strategies but this one simple Pi Line concept is irrefutable evidence that there is a hidden design to markets and under the surface of what seems to be chaotic random events, there-in underneath the complex lies repeatable cyclical patterns and my Pi line concept proves this. Here are just a few examples of the many occurrences you will find on the charts concerning our Pi Line concept:
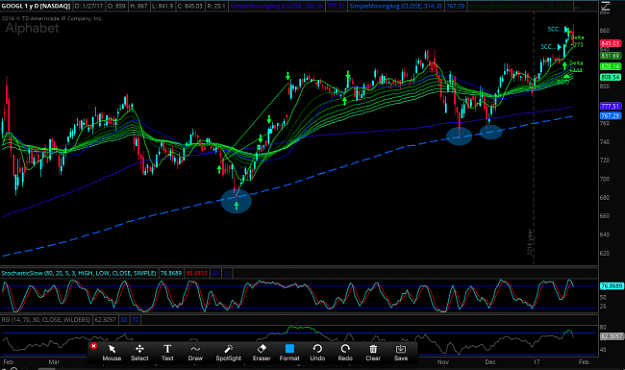
Heres a Daily Chart of Alphabet (GOOGL) showing our Pi Line as the dashed blue line, notice how price holds in this area 3x in the last 12 months each time being a significant low:
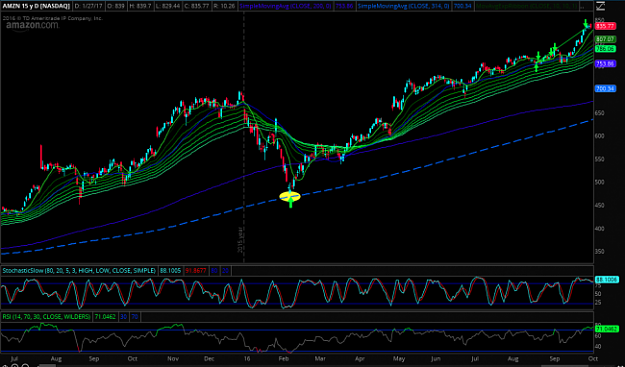
Heres an example of a long-term chart of Amazon (AMZN) holding the Pi line on the daily chart:
Heres an example of Facebook (FB) holding and basing in-front of Pi:
And we can see these examples across other asset classes and on smaller timeframes. Here is an example of EURUSD on the 1 Hour chart (Price holding Pi as shown per the yellow circles):
Heres an FX example, the Dollar vs the Mexican Peso, this is a 1 hour chart example, price cycled away from the Pi line only to cycle back and produce a subsequent failure at Pi:
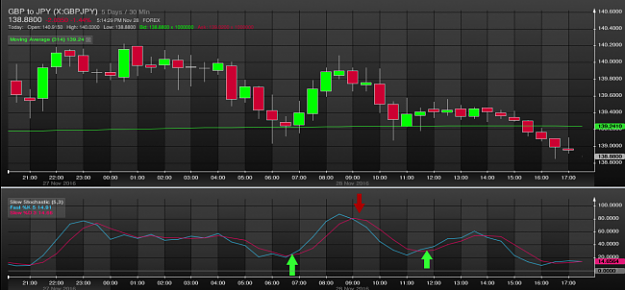
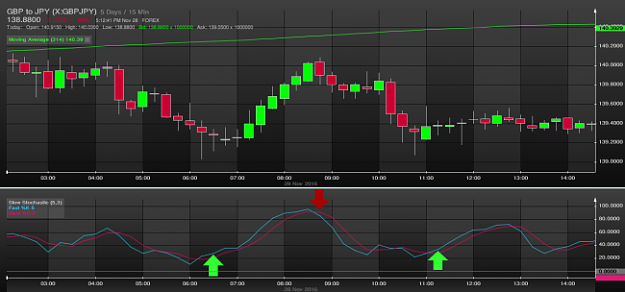
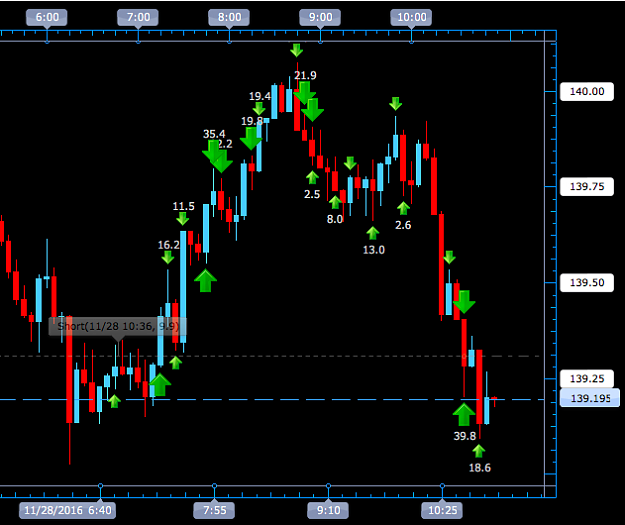
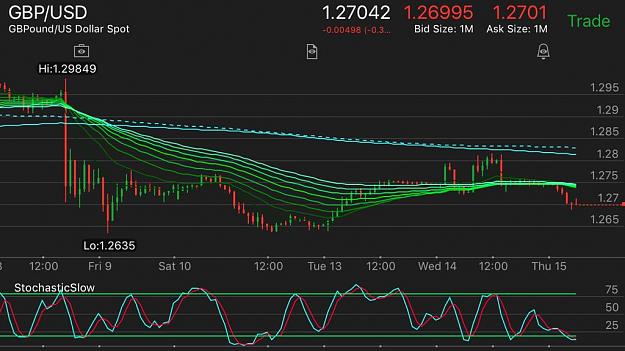
This Pi line technique produces significant highs and lows like this often to the exact level. Lastly, this is one of my favorite examples, the exact high of the move on the day of Brexit we saw the Pound fail right up at Pi (the green down arrow is showing our sell signal). You can also see multiple failures at Pi in 2015 highlighted in yellow:
These types of events, both highs and lows with the Pi Cycle are very common across all timeframes and in all markets. Now we do not just simply buy and sell when price hits the Pi Line nor do we go bullish or bearish just based off price being above or below this line. Our model to reiterate is more in depth and our process we teach our traders only begins with the Pi Line. But as an overall good general rule, our Pi Line acts as a great starting point to begin an individual's trade and many successful trade setups occur at or near this significant cycle line. I will come back to the Pi Line concept in the video at the end of section 3 and I will demonstrate how we incorporate this Pi line concept with the other cycle indicators that we use. However, before we get into the next Oscillating Cycle setup I want to touch on something else that is key to proper cycle trading; and that is learning how to work the right position size in and around the cycles.
Let's begin with an understanding of a few basic concepts surrounding time and cycles, and how we use these cyclical approaches in our trading to produce high probable market setups. One of the core concepts in my trading model is what I call the Pi Line. Pi is the ratio of the circumference of a circle to its diameter, and Pis mathematical significance is well known throughout many fields and its origins go back to antiquity.
Pi has been represented by the Greek letter π, and because its definition relates to the circle, π is found in many formulas in geometry and trigonometry.
Attached Image
Pi appears in other sciences such as number theory and statistics, as well as it is found in thermodynamics, mechanics, and electromagnetism. We can also see the numerical significance of Pi in cyclical wave structures, sine and cosine functions repeat with a period of 2 π this oscillation and wave form creates a rhythm of time. It is these oscillations and wave formations that we try to identify in our trading. Much like the rhythm of a pendulum, we look to trade around the same rhythms of time on the chart.
It is this oscillation through time that creates this cyclical rhythm and these mathematical constants show that there is an underlying structure and geometry of not just space but also TIME. In this next section lets examine what I call in my proprietary trading model the Jenkins Pi Line concept.
Attached Image
Section 1: The Jenkins Pi Line
The price action on a chart is simply energy moving through people in what we call the markets. Everything moves in waves - it's how energy travels. This is why we built our model around such wave formation cyclical vibration. Pi defines the circle and thus it is the perfect cycle, this is why I originally began to search for ways to incorporate this cyclical and mathematical phenomenon in our trading model. What I discovered next was really a very simple basic discovery but one that produces amazing results on the price charts on all timeframes.
I decided to put Pi on the chart. I was looking for a longer moving average to incorporate into our trend analysis and decided why not take Pi 3.14 x100 and put a 314 simple period moving average on our chart. When I did, I was astonished at the accuracy and the frequency in which price made prominent highs and lows putting in tops and bottoms often times to the exact level as the moving average line itself. The incredible number of failures and bounces off this line was outstanding and it happens regardless of the time frame. I knew in my 15 years of trading and all my institutional experience talking to some of the largest and most well respected traders that I had never heard of anyone using such a moving average. Its fair to say that most traders never even go out past the well used 200 period moving average. So, I knew the idea of a self fulfilling prophecy with everyone using the same 314 period moving average was not a contributing factor as to why this average was doing such a spectacular job at defining price action. There was clearly more to why this moving average line worked so well. This was and is clearly proof of an underlying cyclical structure to how energy moves.
In our JRM Trading Model we do not use any one particular moving average nor do we use simplistic moving average crosses to determine when we buy and sell. Our model is much more complicated than such strategies but this one simple Pi Line concept is irrefutable evidence that there is a hidden design to markets and under the surface of what seems to be chaotic random events, there-in underneath the complex lies repeatable cyclical patterns and my Pi line concept proves this. Here are just a few examples of the many occurrences you will find on the charts concerning our Pi Line concept:
Heres a Daily Chart of Alphabet (GOOGL) showing our Pi Line as the dashed blue line, notice how price holds in this area 3x in the last 12 months each time being a significant low:
Attached Image (click to enlarge)
Heres an example of a long-term chart of Amazon (AMZN) holding the Pi line on the daily chart:
Attached Image (click to enlarge)
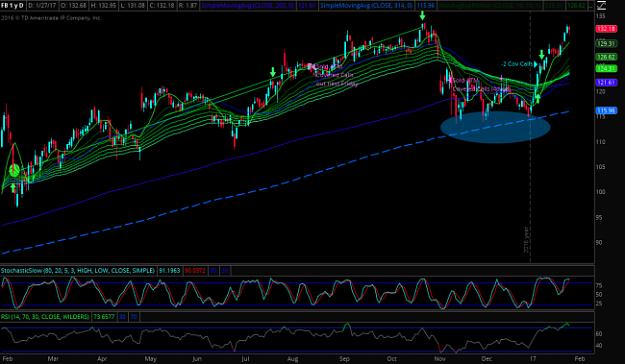
Heres an example of Facebook (FB) holding and basing in-front of Pi:
Attached Image (click to enlarge)
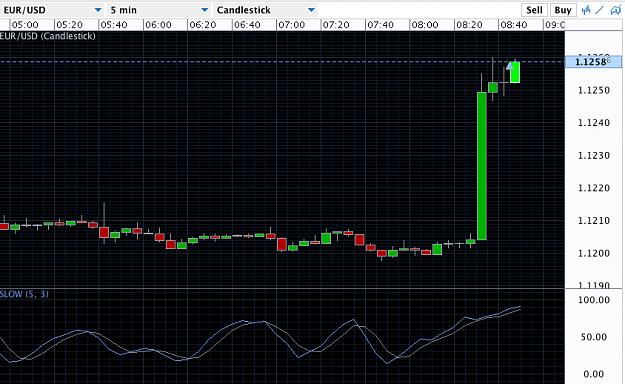
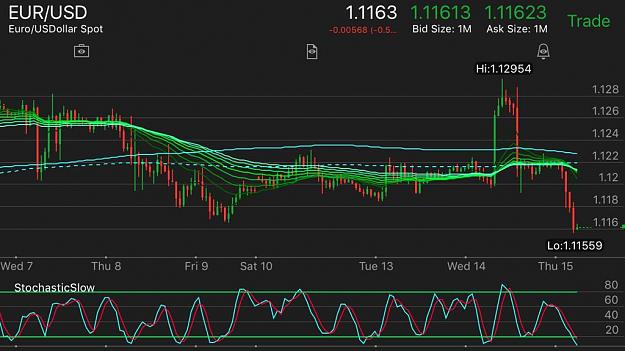
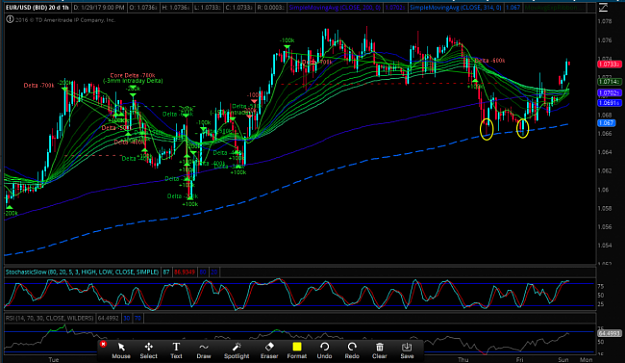
And we can see these examples across other asset classes and on smaller timeframes. Here is an example of EURUSD on the 1 Hour chart (Price holding Pi as shown per the yellow circles):
Attached Image (click to enlarge)
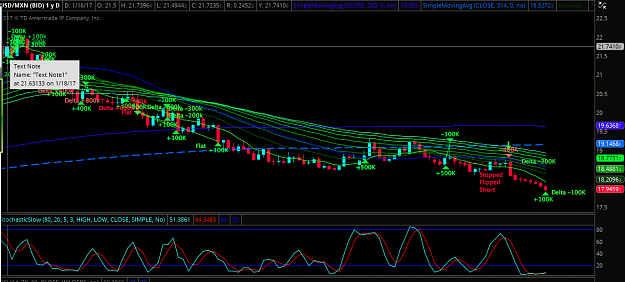
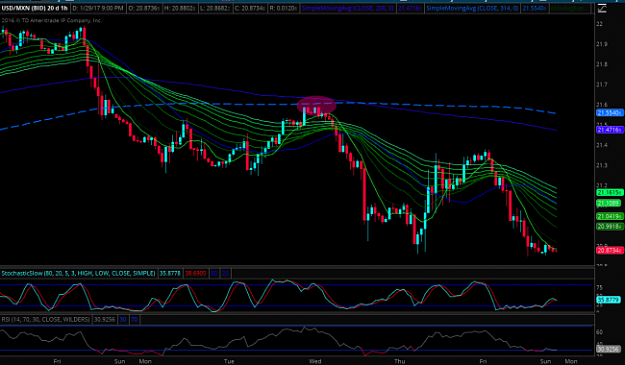
Heres an FX example, the Dollar vs the Mexican Peso, this is a 1 hour chart example, price cycled away from the Pi line only to cycle back and produce a subsequent failure at Pi:
Attached Image (click to enlarge)
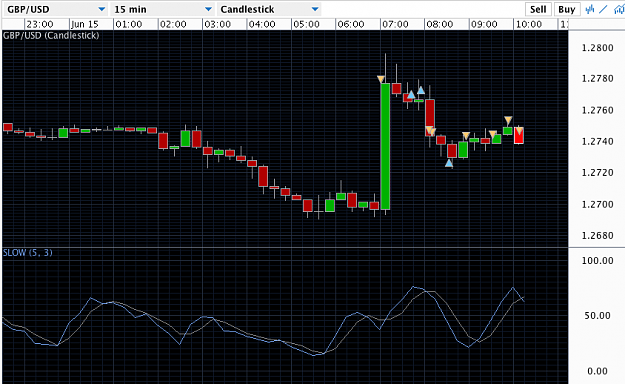
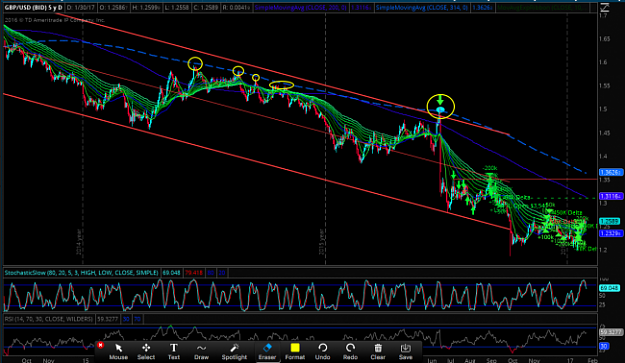
This Pi line technique produces significant highs and lows like this often to the exact level. Lastly, this is one of my favorite examples, the exact high of the move on the day of Brexit we saw the Pound fail right up at Pi (the green down arrow is showing our sell signal). You can also see multiple failures at Pi in 2015 highlighted in yellow:
Attached Image (click to enlarge)
These types of events, both highs and lows with the Pi Cycle are very common across all timeframes and in all markets. Now we do not just simply buy and sell when price hits the Pi Line nor do we go bullish or bearish just based off price being above or below this line. Our model to reiterate is more in depth and our process we teach our traders only begins with the Pi Line. But as an overall good general rule, our Pi Line acts as a great starting point to begin an individual's trade and many successful trade setups occur at or near this significant cycle line. I will come back to the Pi Line concept in the video at the end of section 3 and I will demonstrate how we incorporate this Pi line concept with the other cycle indicators that we use. However, before we get into the next Oscillating Cycle setup I want to touch on something else that is key to proper cycle trading; and that is learning how to work the right position size in and around the cycles.