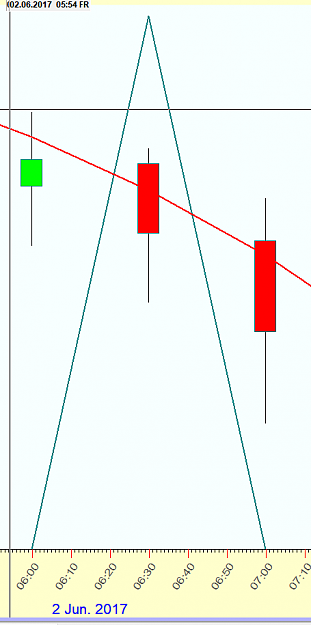
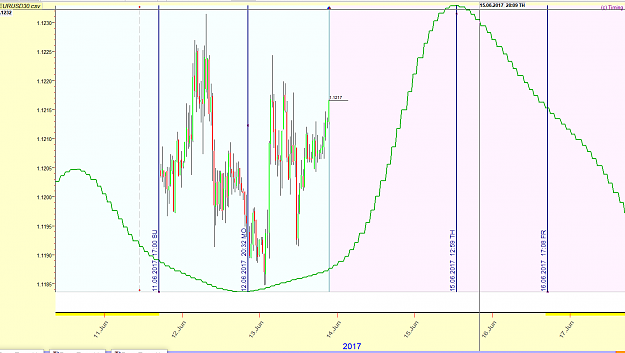
{quote} Hi Paul, Here is a Timing solution view of the Moon Squaring the Ascendant last week... and an Astrolog confirmation on the inset for 6 am Friday morning EDT (New York) {image}
Ignored
Hi jnevins Asc at NY is a nice signal for EU
It would be nice if we get stats on this particular correlation - as ones performed in Q-Box (post#8339)
We had plenty of events during the weekend that will create a CIT withing few hours.
Venus conj. Ouran
Sun 144* PL.
Moon 0* S
Sun trine Jup.
Sun sq. Nept.
Merc.sq.Sat. HELIO
I am expecting a top in E. [as Jerry does ,too...] and a low in $JY SOON.....
The stars are looking at you from above ,crew . . .
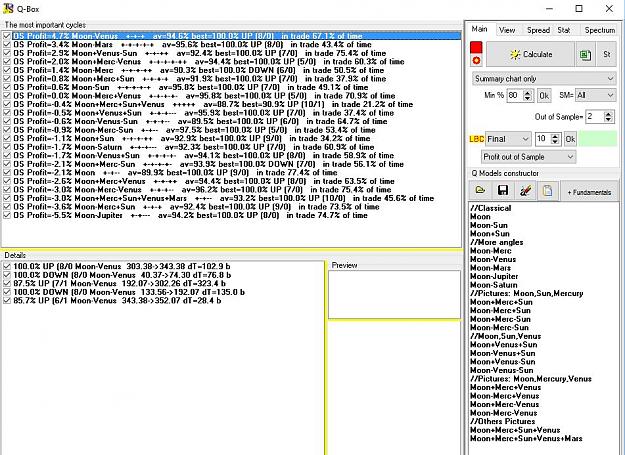
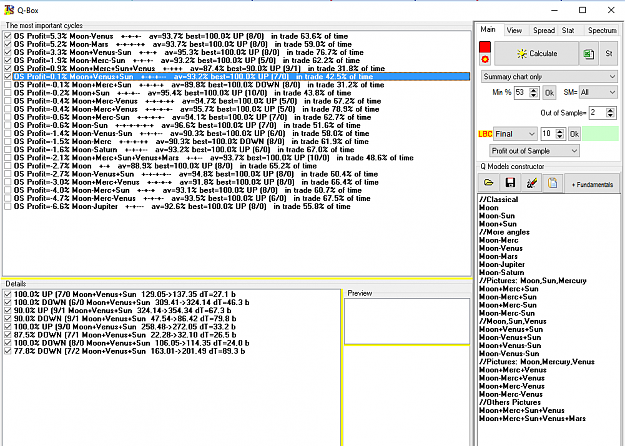
Here is a slightly simplified version of the chart I posted previously using new Q Box implementation and the "Big Moon" preset... Note that the program put a check mark next to the top 6 cycles....
{quote} Hi jnevins Asc at NY is a nice signal for EU It would be nice if we get stats on this particular correlation - as ones performed in Q-Box (post#8339)
Ignored
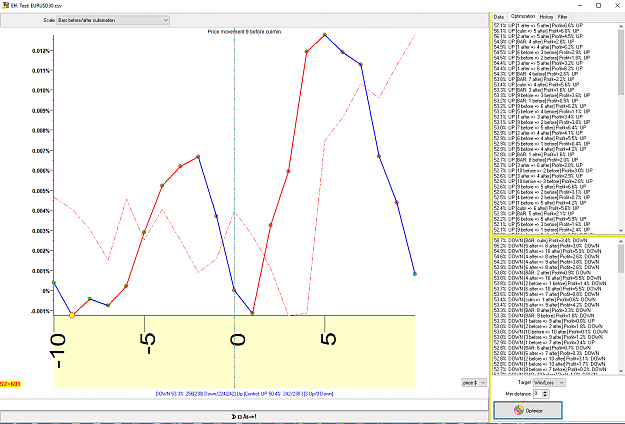
Here you go...
To read the chart, There is a graphic display of each bar before the peak of the aspect and bars after. On the right is a statistical analysis of each combination... so at the top right, it shows that 57.1% of the time, price went up from 1 bar after the culmination to 5 bars after... , next down, culmination to 5 after, 56.1%, etc... Below the yellow bar are the combinations that yielded a down effect... Each bar is 30 min... What the stats don't reveal though is what percent of the time sees a CIT (change in trend)....
Notice that in the down portion, that the cumulating bar has a tendency to go down (58.7% of the time) ... Here is a detail of the last occurrence on Friday morning NY time... Note, the shape of the aspect is showing a 4 degree orb... The red projection line is a Q Box line.
{quote} Here you go... To read the chart, There is a graphic display of each bar before the peak of the aspect and bars after. On the right is a statistical analysis of each combination... so at the top right, it shows that 57.1% of the time, price went up from 1 bar after the culmination to 5 bars after... , next down, culmination to 5 after, 56.1%, etc... Below the yellow bar are the combinations that yielded a down effect... Each bar is 30 min... What the stats don't reveal though is what percent of the time sees a CIT (change in trend).......
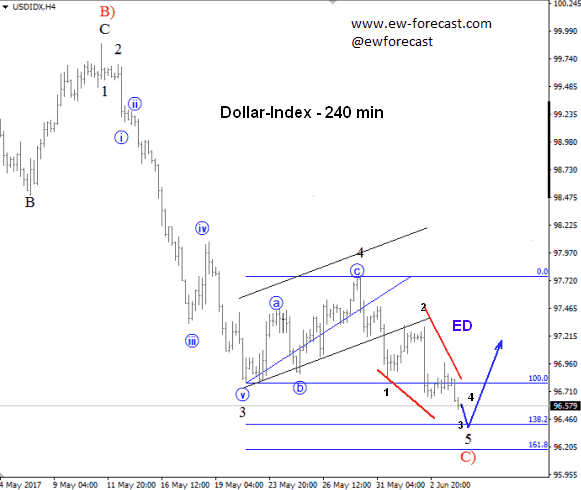
The "topping" of the EURUSD will continue until the low of the Dollar-Index is reached.
Wave "5" of "C)" seems to be an "ED" pattern which is nearly finished.
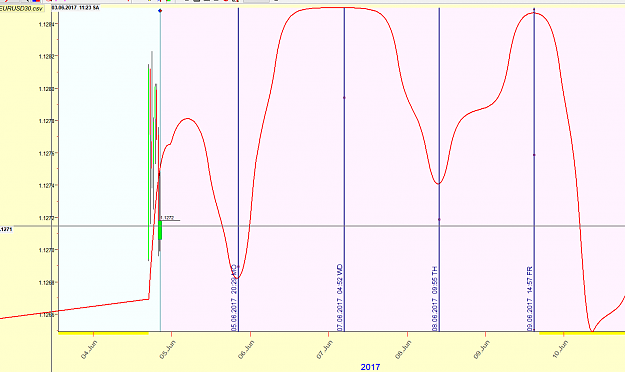
{quote} Steps are due to julian day formula {image}
Ignored
Dear Paul,
I was away enjoying summer holidays so cant reply to this post of yours.
The image which I had attached is for 15M. Even for 5M charts, steps are seen.
Please check.
{quote} Dear Paul, I was away enjoying summer holidays so cant reply to this post of yours. The image which I had attached is for 15M. Even for 5M charts, steps are seen. Please check. Regards piptakers
Ignored
Hello piptakers
did u try new indi attached at post#8333 ? ..with which lines are smoothed very fine
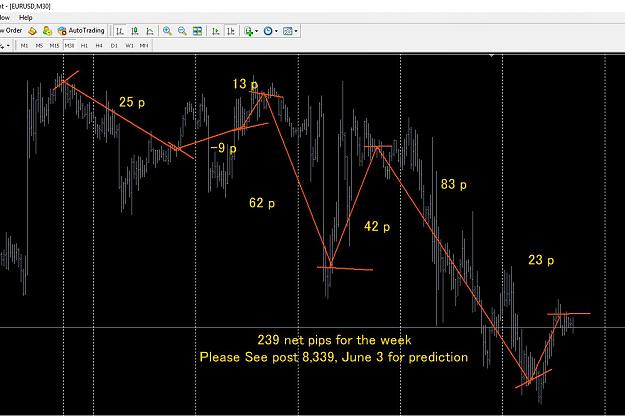
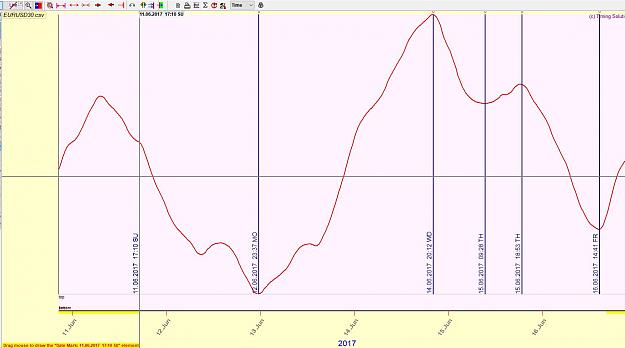
Net gain for the week was 239 pips. The new Q Box implementation in Timing Solution did a good job in catching each change in trend this week. Please see Post 8,339, June 3, for predictive chart. https://www.forexfactory.com/attachm...6&d=1496545722
EUR/USD, 30 min bars, EDT End of the week wrap-up Net gain for the week was 239 pips. The new Q Box implementation in Timing Solution did a good job in catching each change in trend this week. Please see Post 8,339, June 3, for predictive chart. https://www.forexfactory.com/attachment.php?attachmentid=2339056&d=1496545722 {image}
Here comes an indi, rather a modified one already shared by "paulselvan" in the post no 8333.
I have added some options to the original indi.
1. User can enter Longitude and Latitude of his (her too ) place in degrees and
minutes along with the directions (E/W or N/S). This option is only for ASC/MC. Default values are for my place.
2. User can plot either one of ASC/MC or both at a time.
3. User can plot longitudes of max. three planets at a time.
4. User can select Geocentric (either Sidereal or Tropical) or Heliocentric System.
5. User can plot 3 horizontal lines at specified intervals. Default is at 90, 180 and 270.
These lines will help user to know the longitudes when crosses at specified degrees.
Please check and let me know about any bugs. Fingers crossed.... Neither Tested Nor Tasted
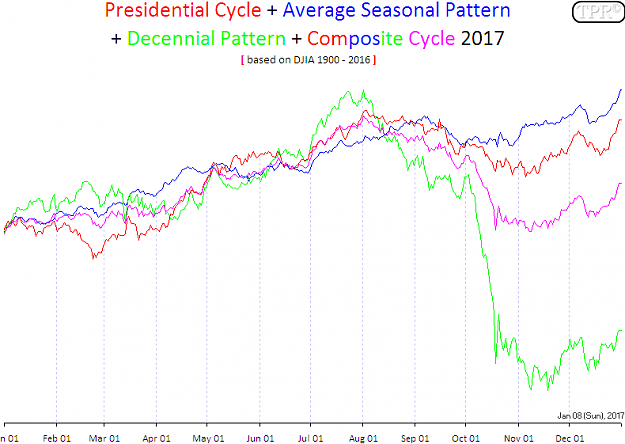
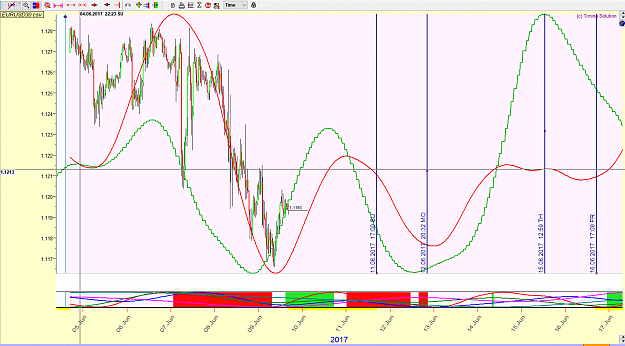
Red line is a composite of longer cycles Using Q box and Q spectrum, combining the two for the cycles that turn up in both. 185 bar, 566 bar, 734 bqar, 990 bar and 1208 bar cycles
Green line adds in Mars-Saturn Phase model, Sm orb 50%, Osc, v.fast
I've zoomed out to show this on blind to the program data from last week as well as this week before adding any data from this week
Hello friends,
Can you share for what reasons you practice astrology ?
- By your religious or philosophical opinions you're confident in destiny.
- You got fine intuition or have the gift of predicting and astrology is used as support.
- Others
Hello friends, Can you share for what reasons you practice astrology ? - By your religious or philosophical opinions you're confident in destiny. - You got fine intuition or have the gift of predicting and astrology is used as support. - Others Tnx
Ignored
Personally I am interested for Artistic, Scientific and Philosophical reasons....
Artistic: I love finding order, symmetry and balance in the "random" movements of the markets... I put random in quotes because that is the prevailing academic view.
Scientific: The study of cycles is fascinating. Experiments can be proposed then tested and verified. Knowledge is gained by the evidence presented rather than by hopes and dreams. Correlation should not be confused with causation.
Philosophical: There is far more to reality than our limited time and space bound perceptions as we inhabit our tiny 3D bodies. Theoretical physics presents us with many eye opening examples of multi-dimensionality and mind bending ways of thinking about time itself.
I just added this week's 30 min EUR/USD data to Timing Solution... what are the probabilities that data up until June 2nd, 11 days ago could be used to predict the shape of the price curve with such precision? The green line is generated solely by the phases of Mars-Saturn, 6th harmonic, geocentric view...(post 8357) Of course it is also fascinating to me that with enough hubris, that knowledge can blow up in your face... so it is best to remain humble and keep searching and experimenting.