• Home
  • Forums
  • Trades
  • News
  • Calendar
  • Market
  • Brokers
  • Login
  • Join
  • User/Email: Password:
  • 3:26pm
Menu
  • Forums
  • Trades
  • News
  • Calendar
  • Market
  • Brokers
  • Login
  • Join
  • 3:26pm
Sister Sites
  • Metals Mine
  • Energy EXCH
  • Crypto Craft

Options

Bookmark Thread

First Page First Unread Last Page Last Post

Print Thread

  • Commercial Content
  • /
  • Reply to Thread
  • Subscribe
  • 6,330
Attachments: Spider's Den
Exit Attachments
Tags: Spider's Den
Cancel

Spider's Den

  • Last Post
  •  
  • 1 11781179Page 118011811182 1209
  • 1 Page 1180 1209
  •  
  • Post #23,581
  • Quote
  • May 19, 2017 12:17am May 19, 2017 12:17am
  •  Ocean Orca
  • | Commercial Member | Joined Jan 2014 | 616 Posts
EUR/USD Loses Steam with Conclusion Wave-3 and Start Wave-4

https://admiralmarkets.com/analytics...d-start-wave-4 - Your capital is at risk
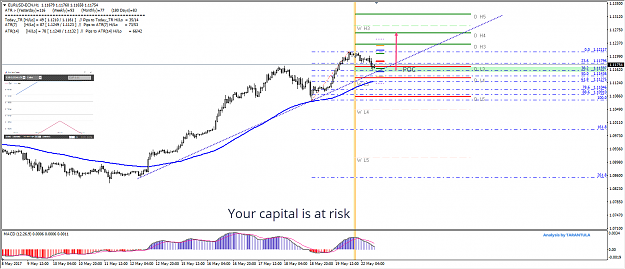
EUR/USD
1 hour
https://fxmedia.s3.amazonaws.com/art...05-2017eu1.png
The EUR/USD bullish momentum of wave 3 (purple) ran out of steam yesterday and started a wave 4 (purple) correction. Price has in the meantime retraced back to the Fibonacci levels of wave 4 which could as potential support and bounce levels.
4 hour
https://fxmedia.s3.amazonaws.com/art...-2017eu4-1.png
The EUR/USD could be retracing towards the 88.6% Fibonacci level of wave 2 (green) via an ABC zigzag (blue).
 
 
  • Post #23,582
  • Quote
  • May 19, 2017 8:01am May 19, 2017 8:01am
  •  [email protected]
  • | Commercial Member | Joined Feb 2010 | 14,361 Posts
GBP/CHF Could Start Correction Soon
Attached Image (click to enlarge)
Click to Enlarge

Name: 2017-05-19_13-25-06.png
Size: 71 KB
 
 
  • Post #23,583
  • Quote
  • May 22, 2017 12:49am May 22, 2017 12:49am
  •  Ocean Orca
  • | Commercial Member | Joined Jan 2014 | 616 Posts
USD/JPY Triangle Pattern Visible at 110 and 61.8% Golden Ratio

https://admiralmarkets.com/analytics...8-golden-ratio - Your capital is at risk

USD/JPY
4 hour
https://fxmedia.s3.amazonaws.com/art...05-2017uj4.png
The USD/JPY bounced at the golden ratio Fib of 61.8% level and it seems likely that the wave C (brown) has been completed once price breaks above the smaller resistance trend line (orange). A break above or below the small contracting triangle chart pattern (green/orange) could play a key role in a push towards the 78.6% Fib or next resistance (red).
1 hour
https://fxmedia.s3.amazonaws.com/art...05-2017uj1.png
The USD/JPY could however first build a wave 4 (orange) correction and a wave 5 (orange) continuation before completing wave C (brown).


Source: https://admiralmarkets.com/analytics...8-golden-ratio Admiral Markets
 
 
  • Post #23,584
  • Quote
  • May 22, 2017 5:42am May 22, 2017 5:42am
  •  [email protected]
  • | Commercial Member | Joined Feb 2010 | 14,361 Posts
EUR/USD Confluence At Daily L3 Camarilla Pivot
Attached Image (click to enlarge)
Click to Enlarge

Name: 2017-05-22_11-17-45.png
Size: 68 KB
 
 
  • Post #23,585
  • Quote
  • May 23, 2017 12:14am May 23, 2017 12:14am
  •  Ocean Orca
  • | Commercial Member | Joined Jan 2014 | 616 Posts
EUR/USD Bullish Price Action Challenges Rising Wedge at 1.1250

https://admiralmarkets.com/analytics...edge-at-1-1250 - Your capital is at risk

EUR/USD
4 hour
https://fxmedia.s3.amazonaws.com/art...05-2017eu4.png
The EUR/USD is showing a bullish continuation within wave 5 (purple), which could complete a wave C (blue). The angle of the support (green) and resistance (red) trend lines are showing a rising wedge reversal chart pattern. However, considering the bullish price action the EUR/USD could test 1.13 first and break either way: above resistance or below support. A break above 1.13 invalidates the wave 2 (green) correction.
1 hour
https://fxmedia.s3.amazonaws.com/art...05-2017eu1.png
The EUR/USD bounced at the 38.2% Fibonacci level of wave 4 (pink) and then broke above the resistance trend line (dotted red). A new 5 wave (pink) formation is most likely occurring within wave 5 (purple).


Source: https://admiralmarkets.com/analytics...edge-at-1-1250 Admiral Markets
 
 
  • Post #23,586
  • Quote
  • May 23, 2017 9:40am May 23, 2017 9:40am
  •  [email protected]
  • | Commercial Member | Joined Feb 2010 | 14,361 Posts
USD/JPY Potential Bullish Wolfe Wave Swing
Attached Image (click to enlarge)
Click to Enlarge

Name: 2017-05-23_14-24-15.png
Size: 53 KB
 
 
  • Post #23,587
  • Quote
  • May 24, 2017 1:16am May 24, 2017 1:16am
  •  Ocean Orca
  • | Commercial Member | Joined Jan 2014 | 616 Posts
EUR/USD Reversal or Correction after Rising Wedge Break

Source: https://admiralmarkets.com/analytics...ng-wedge-break Admiral Markets


EUR/USD
4 hour
https://fxmedia.s3.amazonaws.com/art...05-2017eu4.png
The EUR/USD failed to break above the 1.1250-1.13 resistance zone and showed a bearish reversal or correction. Price also broke below the rising wedge chart pattern which is indicated by the broken support (dotted green) and resistance (red).
 
 
  • Post #23,588
  • Quote
  • May 25, 2017 1:06am May 25, 2017 1:06am
  •  Ocean Orca
  • | Commercial Member | Joined Jan 2014 | 616 Posts
EUR/USD Approaches Break or Bounce Zone at 1.1250

Source: https://admiralmarkets.com/analytics...zone-at-1-1250 Admiral Markets


EUR/USD
4 hour
https://fxmedia.s3.amazonaws.com/art...05-2017eu4.png
The EUR/USD is challenging the previous top near 1.1250 which is a major decision zone for either a bullish breakout or a bearish reversal. The critical level is the 100% Fibonacci at 1.1268: a break above this resistance top invalidates wave 2 (blue) whereas a break above 1.13 invalidates another bearish wave 2 (green). A bearish reversal, however, could see price break below support (blue).
1 hour
https://fxmedia.s3.amazonaws.com/art...05-2017eu1.png
The EUR/USD has arrived at a key 78.6% Fibonacci resistance which is bearish bounce (reversal) or bullish breakout zone.
 
 
  • Post #23,589
  • Quote
  • May 25, 2017 8:44am May 25, 2017 8:44am
  •  [email protected]
  • | Commercial Member | Joined Feb 2010 | 14,361 Posts
AUD/USD Respecting The Channel

Attached Image (click to enlarge)
Click to Enlarge

Name: 2017-05-25_14-07-56.png
Size: 44 KB
 
 
  • Post #23,590
  • Quote
  • May 28, 2017 5:09am May 28, 2017 5:09am
  •  [email protected]
  • | Commercial Member | Joined Feb 2010 | 14,361 Posts
5 Tips to Develop An Edge in Trading

Attached Image (click to enlarge)
Click to Enlarge

Name: twitter.png
Size: 618 KB
 
 
  • Post #23,591
  • Quote
  • May 29, 2017 1:36am May 29, 2017 1:36am
  •  Ocean Orca
  • | Commercial Member | Joined Jan 2014 | 616 Posts
EUR/USD Builds Bull Flag Pattern or Bearish Channel

Source: https://admiralmarkets.com/analytics...earish-channel Admiral Markets

EUR/USD
4 hour
https://fxmedia.s3.amazonaws.com/art...05-2017eu4.png
The EUR/USD failed to break above the 1.1250 resistance zone so far which is a major decision zone for either a bullish breakout or a bearish reversal. The critical level is the 100% Fibonacci at 1.1268: a break above this resistance top invalidates wave 2 (blue) whereas a break above 1.13 invalidates another bearish wave 2 (green). A bearish reversal, however, could see price break below support (blue).
1 hour
https://fxmedia.s3.amazonaws.com/art...05-2017eu1.png
The EUR/USD seems to have completed a wave 2 (blue) but a break below the support trend line (blue) is needed before a wave 3 (blue) could unfold. A break above the resistance line (red) invalidates the current bearish wave structure. At the moment the EUR/USD is either building a bull flag continuation chart pattern or the start of a bearish reversal, which will depend on the direction of the breakout.
 
 
  • Post #23,592
  • Quote
  • May 29, 2017 4:36am May 29, 2017 4:36am
  •  [email protected]
  • | Commercial Member | Joined Feb 2010 | 14,361 Posts
GBP/JPY Now Moment Sellers Could Be Waiting At Confluence Zone
Attached Image (click to enlarge)
Click to Enlarge

Name: 2017-05-29_9-54-57.png
Size: 59 KB
 
 
  • Post #23,593
  • Quote
  • May 30, 2017 1:07am May 30, 2017 1:07am
  •  Ocean Orca
  • | Commercial Member | Joined Jan 2014 | 616 Posts
EUR/USD Bearish Breakout Starts Wave 3 Momentum

Source: https://admiralmarkets.com/analytics...ave-3-momentum Admiral Markets


EUR/USD
4 hour
https://fxmedia.s3.amazonaws.com/art...05-2017eu4.png
The EUR/USD has broken below the support trend line (dotted blue) which could kick start momentum within wave 3 (blue) towards the Fibonacci targets. A break above the resistance (red/orange) invalidates the wave 3 formation.
1 hour
https://fxmedia.s3.amazonaws.com/art...05-2017eu1.png
The EUR/USD seems to be building a 5 wave extension (purple) within the 3rd wave (blue).

Source: https://admiralmarkets.com/analytics...ave-3-momentum Admiral Markets
 
 
  • Post #23,594
  • Quote
  • May 30, 2017 8:40am May 30, 2017 8:40am
  •  [email protected]
  • | Commercial Member | Joined Feb 2010 | 14,361 Posts
AUD/USD Bullish As Long As 0.7400 Holds
Attached Image (click to enlarge)
Click to Enlarge

Name: 2017-05-30FXstreet.jpg
Size: 290 KB
 
 
  • Post #23,595
  • Quote
  • May 31, 2017 1:10am May 31, 2017 1:10am
  •  Ocean Orca
  • | Commercial Member | Joined Jan 2014 | 616 Posts
GBP/USD Wave-4 Pullback to 61.8% Fib Ahead of UK Elections

Source: https://admiralmarkets.com/analytics...f-uk-elections Admiral Markets


GBP/USD
4 hour
https://fxmedia.s3.amazonaws.com/art...05-2017gu4.png
The British Pound weakened last week ahead of the UK elections which will take place on Thursday 8 June 2017. Some opinion polls are showing a shrinking lead for the current Prime Minister Theresa May of the Conservative party and a rebound for the Labour opposition party but a full week of campaigning still remains in front of the UK.
The GBP/USD channel (green lines) is a bear flag chart pattern and a potential bearish break could see price continue with wave 3 (blue). A bullish break above the channel, however, could change the wave structure.
1 hour
https://fxmedia.s3.amazonaws.com/art...05-2017gu1.png
The GBP/USD completed an ABC (grey) correction at the 50-61.8% Fibonacci zone of wave 4 (orange).

Source: https://admiralmarkets.com/analytics...f-uk-elections Admiral Markets
 
 
  • Post #23,596
  • Quote
  • May 31, 2017 11:46am May 31, 2017 11:46am
  •  LatvianFX
  • | Joined Jul 2013 | Status: Member | 25 Posts
Hi,Nenand!

Missed your todays webinar. Mybe you could post here slides of posible trades that we could open.
Many thanks in advance
 
 
  • Post #23,597
  • Quote
  • Jun 1, 2017 1:26am Jun 1, 2017 1:26am
  •  Ocean Orca
  • | Commercial Member | Joined Jan 2014 | 616 Posts
EUR/USD Faces Massive Decision between 1.12 Support and 1.13 Resistance

Source: https://admiralmarkets.com/analytics...3-resistance-1 Admiral Markets


EUR/USD
4 hour
https://fxmedia.s3.amazonaws.com/art...06-2017eu4.png
The EUR/USD broke above the resistance trend line (dotted red) and invalidated the bearish wave structure. The new wave count is showing the alternative 3 wave ABC (blue) within wave 4 (purple). The resistance at 1.13 and the support (green) at 1.12 are very important levels as the breakout will provide key information about the next potential trend.
1 hour
https://fxmedia.s3.amazonaws.com/art...06-2017eu1.png
The EUR/USD broke above the resistance (dotted red) and the wave structure could now be a bullish version with a wave 123 (blue). To confirm this wave count, however, price will need stay above support (green) and reach the 161.8% Fib target.

Source: https://admiralmarkets.com/analytics...3-resistance-1 Admiral Markets
 
 
  • Post #23,598
  • Quote
  • Jun 1, 2017 5:40am Jun 1, 2017 5:40am
  •  [email protected]
  • | Commercial Member | Joined Feb 2010 | 14,361 Posts
Quoting LatvianFX
Disliked
Hi,Nenand! Missed your todays webinar. Mybe you could post here slides of posible trades that we could open. Many thanks in advance
Ignored
Hey,

Here is the link. have in mind that I did 2 live trades, both came in profits + USDJPY is in profit now

Inserted Video
 
 
  • Post #23,599
  • Quote
  • Jun 2, 2017 1:14am Jun 2, 2017 1:14am
  •  Ocean Orca
  • | Commercial Member | Joined Jan 2014 | 616 Posts
USD/JPY Completes Truncated Wave 5 and Starts Bullish Wave 1

Source: https://admiralmarkets.com/analytics...bullish-wave-1 Admiral Markets


USD/JPY
4 hour
https://fxmedia.s3.amazonaws.com/art...06-2017uj4.png
The USD/JPY has broken above the resistance trend line (dotted orange) which confirms the completion of wave 5 (orange) within wave C (brown). This particular wave 5 failed to break below the low of wave 3 which is called a truncated wave 5. The new bullish momentum could indicate the start of a wave 1 (purple).
1 hour
https://fxmedia.s3.amazonaws.com/art...06-2017uj1.png
The USD/JPY bullish momentum has 5 internal waves (grey) within wave 1 (purple). Price could be heading towards the Fibonacci targets of wave 5 (grey).

Source: https://admiralmarkets.com/analytics...bullish-wave-1 Admiral Markets
 
 
  • Post #23,600
  • Quote
  • Jun 4, 2017 2:38am Jun 4, 2017 2:38am
  •  Ocean Orca
  • | Commercial Member | Joined Jan 2014 | 616 Posts
Breaking Your Bad Habits and Sticking to Your Trading Plan

Source: https://admiralmarkets.com/analytics...r-trading-plan Admiral Markets


Dear traders,

Do you sometimes come to realise that you've failed to follow your original oh-so-brilliant trading plan?
Unfortunately, there is always a gap between theory and practice. The good news is that even the smallest change can be of massive help.
The key aspect is to cautiously monitor how and when you tend to break the rules and set up a new pattern that will help you implement your trading plan efficiently.

The Faults in Trading Plans
Most traders realise the importance of setting up a trading plan, which should preferably be solidified on PC, tablet, mobile, or paper. The plan should be, at the very least, crystal clear in our minds.
The trading plan itself is not a shortcut or instant guarantee for profitable trading. In fact, it is relatively simple not to follow the rules of the plan, both by accident or on purpose.
Catchy terms like discipline and persistence are thrown into the air as potential solutions, doing little to help us traders in the heat of battle when a trading decision must be taken.
The main problem is that trading plans are mostly theoretical, they sound good on paper, but often cannot compete with the internal pressure to make quick, impulsive decisions in the face of price movement and market volatility.
In my view, practical step-by-step guidance is needed to bridge the gap between the trading plan in theory and your actions and decisions in practice.
During my years of actual trading experience, I identified two key concepts that help me the most in successfully implementing goals and plans in general and trading plans in particular.

Focusing on Pattern Breaks
Each trader responds to trading situations with in-built automatic responses. This is actually necessary to avoid over-thinking and over-analysing when trading.
Some of this unconscious behaviour, however, is most likely leading us in the wrong direction. Here is how you can start:

  1. The first step is to observe your own actions. A trader's task is to monitor their actions and record which patterns impact trading negatively.
  2. Next, try to fully understand which decisions lead you to breaking the trading plan.
  3. The final step is to break, or interrupt, the pattern and replace it with the desired action.

In the past, I had difficulties with......

Source: https://admiralmarkets.com/analytics...r-trading-plan Admiral Markets


  • Commercial Content
  • /
  • Spider's Den
  • Reply to Thread
    • 1 11781179Page 118011811182 1209
    • 1 Page 1180 1209
0 traders viewing now
  • More
Top of Page
  • Facebook
  • Twitter
About FF
  • Mission
  • Products
  • User Guide
  • Media Kit
  • Blog
  • Contact
FF Products
  • Forums
  • Trades
  • Calendar
  • News
  • Market
  • Brokers
  • Trade Explorer
FF Website
  • Homepage
  • Search
  • Members
  • Report a Bug
Follow FF
  • Facebook
  • Twitter

FF Sister Sites:

  • Metals Mine
  • Energy EXCH
  • Crypto Craft

Forex Factory® is a brand of Fair Economy, Inc.

Terms of Service / ©2023