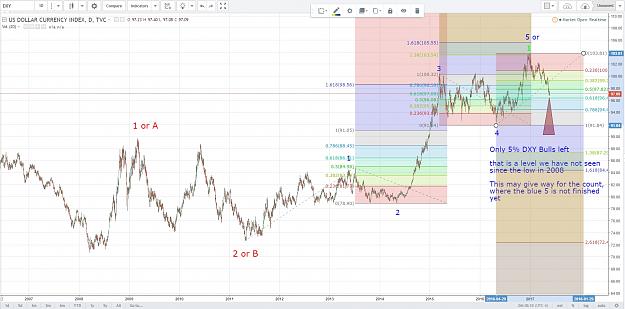
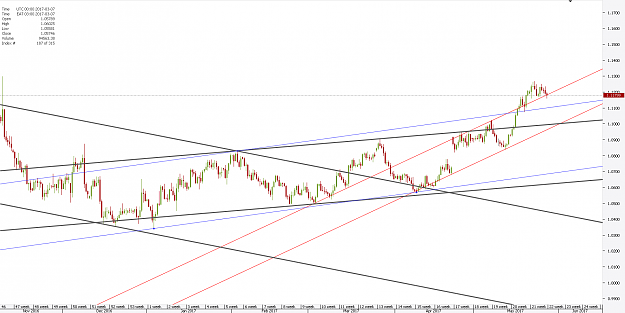
well, right now we have only around 5-7% DXY bulls left. That alone may call for a rally sooner than later. The only time out of my experience, when the masses are right for a long time, is in the center of a wave 3 on multiple degree.
But here we are only a relatively tiny movement away from the highs, and the structure does not look like a 3 of a 3.
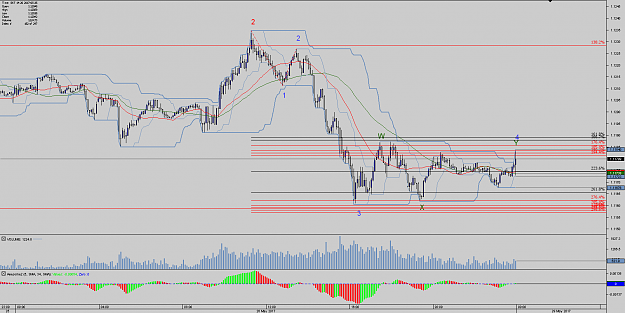
Regarding the blue impulse up: wave 1 (blue) is nearly equal wave 5 blue. Although the wave 5 blue has no clear impulsive pattern, I decided to label it as wave 5, because of wave 1 blue = wave 5 blue.
Time wise, 80% of all wave 4 are within the 0-175% of wave 2. We have around 100% in this case.
If we imply that since the wave 3 blue top all following action is a broad wave 4, then we are running quickly out of probability, because only very few times
wave 4 is bigger than 200% of wave 2 time-wise.
In this case, the count from the blue 3 top would be kind of an ABC-flat, where we are now in wave C down.
The wave C of a flat is ideally between 100-200% of wave A. We are a bit short here of the 100%
Also the wave C of a flat should be ideally between around 80-170% of wave B. Right now we are somewhat around 60% roughly.
The structure down from the blue 5 looks at the moment like a double 3.
For me, above all counts, structure and time considerations, is the fact, that the bears right now are so many (95%).
DXY count daily TF well, right now we have only around 5-7% DXY bulls left. That alone may call for a rally sooner than later. The only time out of my experience, when the masses are right for a long time, is in the center of a wave 3 on multiple degree. But here we are only a relatively tiny movement away from the highs, and the structure does not look like a 3 of a 3. Regarding the blue impulse up: wave 1 (blue) is nearly equal wave 5 blue. Although the wave 5 blue has no clear impulsive pattern, I decided to label it as wave 5, because of wave...
Ignored
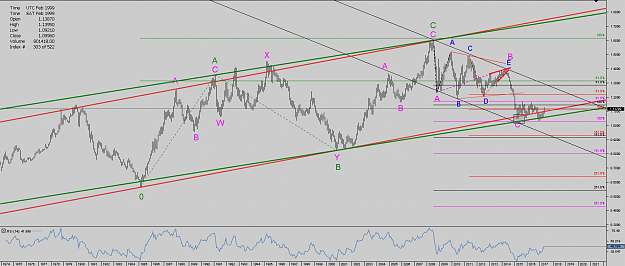
keep also an eye on the red 1,2 respective the red AB:
Hmmm, a lot of this foreign feeded housing bubbles could be avoided, when the government would prohibit the buying of houses and soil by foreigners, or if they would set contingencies.
But wait, they all profit from this game of "money out of thin air" - only John Doe is standing holding the bag
this site http://www.timingcharts.com/ was my source of the COT Index Unfortunately they have fuc!ed up their charting system, especially the COT system. Has anyone a good source for the COT index? I have means to calculate it myself. But the data import from the raw data is a real pain
3a. We have analyzed thousands of charts on multiple timeframes and have found a few rules and/or guidelines that MAY be a bit too strict. For example, the rule that states "Waves 1, 2, 3, 4 and 5 of an ending diagonal always subdivide into zigzags" seems to be a bit too stringent as a hard rule, as we believe we have found examples when an Ending Diagonal does not subdivide in this manner. So, are there any plans to update any of the rules within the standard EW structure now that we have decades of further real world example of chart patterns?
An Elliott wave group in Russia asked if diagonals can occasionally have a third wave longer than wave one. The answer is pretty much the same:
I believe it likely that strict rules apply to the inferred Elliott waves of shared mood. But there are no categorical imperatives pertaining to records of the actions people take to express their moods. Market prices are imperfect reflections of market mood, because they record only people's actions. Waves at small degrees -- intraday -- are especially imperfect because some individual trading actions can be either forced or impeded by circumstances. Until we can probe people's brains to record waves of social mood directly, we are stuck with this imperfection. If you read the paragraph on page 86 of Elliott Wave Principle titled "A Summary of Rules and Guidelines for Waves," you can see that I explicitly stated this point in the book.
Figure 1-18 in that book, which was published in 1978, shows a long third wave in a contracting diagonal, and waves two and four don't even overlap. I decided as soon as it ended that a diagonal was the best count, since the subdivisions were three waves, the shape was a wedge, and it was the fifth wave of a decline. Sure enough, the market reversed after it was over.
Until we have a statistical answer to the question of when to allow this or that variation, the best answer is a practical one, and here is mine: The only time an analyst should allow an imperfection in a wave is retrospectively when all other aspects of the wave demand it. Suppose you see a wedge-shaped fifth wave with 4-1 overlap and three-wave subdivisions, but wave 3 is longer than wave 1, or one of the waves subdivides into a five. If your next alternative is even less compatible with the model, then label the wave a diagonal.
One should never bet that a developing diagonal will break from the standard form. It will lead you to trouble 9 times out of 10. But once the wave ends, a diagonal with a quirk may be better than any alternative. That is how to use rules. There is no purist solution for this issue; there is only the best solution.
http://www.safehaven.com/article/442...d-his-new-book that is an interesting interview with Prechter read whole article snipset: 3a. We have analyzed thousands of charts on multiple timeframes and have found a few rules and/or guidelines that MAY be a bit too strict. For example, the rule that states "Waves 1, 2, 3, 4 and 5 of an ending diagonal always subdivide into zigzags" seems to be a bit too stringent as a hard rule, as.
Ignored
5a. As I am sure you are well aware, there is a debate amongst various schools of thought as to what is more important -- price or time. Can you please give us insight into your perspective on this debate?
What matters most is form. Form involves both price and time, although arguably price is the more definitive component.
6c. What are your top three arguments to present to those who do not believe in socionomics but still hold fast to the old exogenous-causation theories?
It took 800 pages in The Socionomic Theory of Finance to present arguments. But I can make three brief statements:
Events and conditions that are often labeled "fundamentals" have no predictability with respect to the behavior of financial markets, so they cannot be causal. (See Chapters 1, 2 and 22.)
Financial markets differ in numerous fundamental ways from economic markets, implying that their behaviors spring from different causes. The key difference is that in economic markets the context is one of relative certainty with respect to one's own personal values, which allows for rational decision-making, whereas in financial markets the context is one of pervasive uncertainty with respect to others' future actions, which prompts people to herd. (See Chapters 12 and 13.)
Postulating unconscious waves of social mood as a hidden variable explains a persistently compatible relationship among myriad social actions, from popular musical tastes to changes in the economy to political actions to women's fashions to trends in the stock market. (See Chapters 8 and 10.)