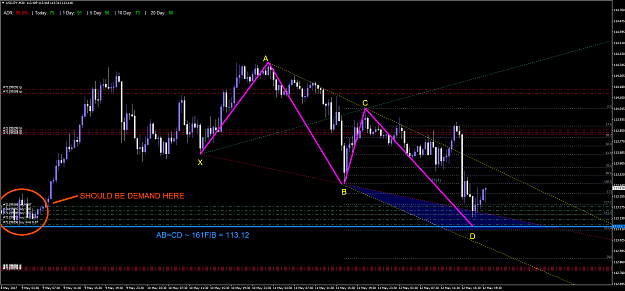
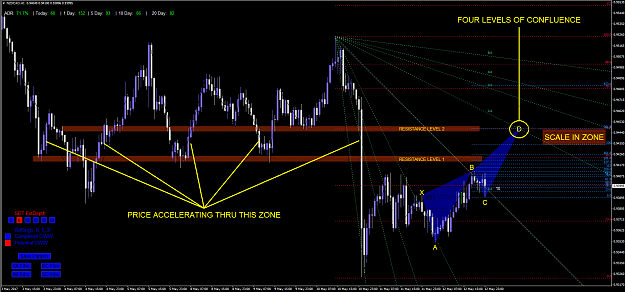
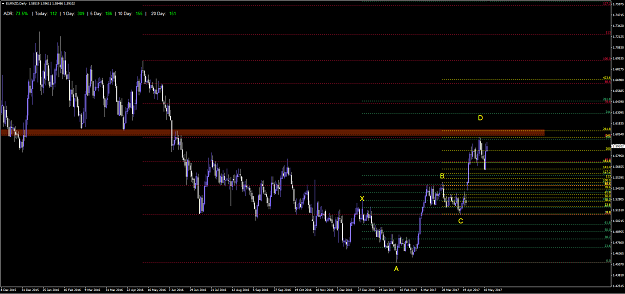
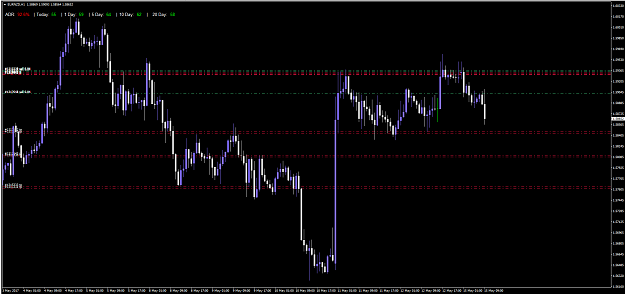
EURUSD 6H Renko [25 pip] Chart CWW:
The orange text maps out the correction.
The CWW has that over balanced look at D[5].
[I remember that being important from my previous WW days]
Cheers, U2
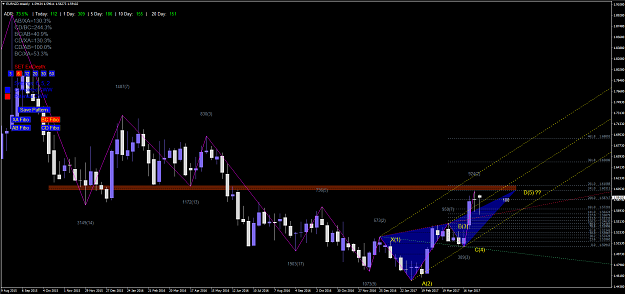
The orange text maps out the correction.
The CWW has that over balanced look at D[5].
[I remember that being important from my previous WW days]
Cheers, U2
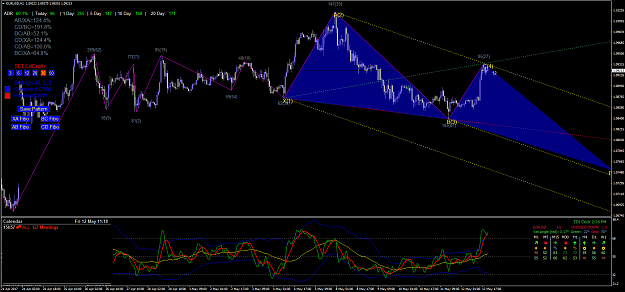
Attached Image (click to enlarge)
![Click to Enlarge
Name: EURUSD 170512 6H [1] WW.png
Size: 94 KB](/attachment/image/2307044/thumbnail?d=1494598748)
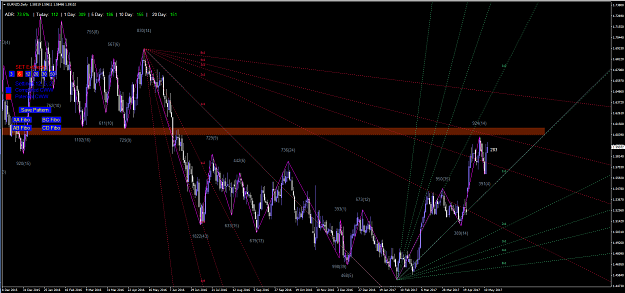
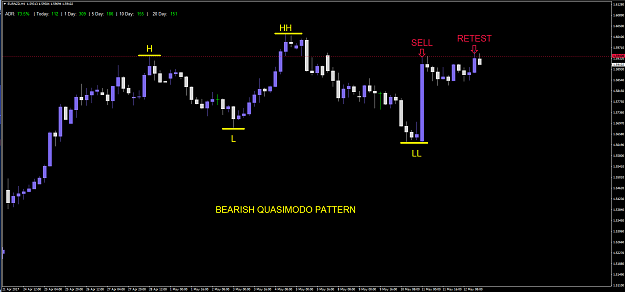
Wait, or you will be slaughtered!
1