GBP/USD Mid-term analysis for April 2017
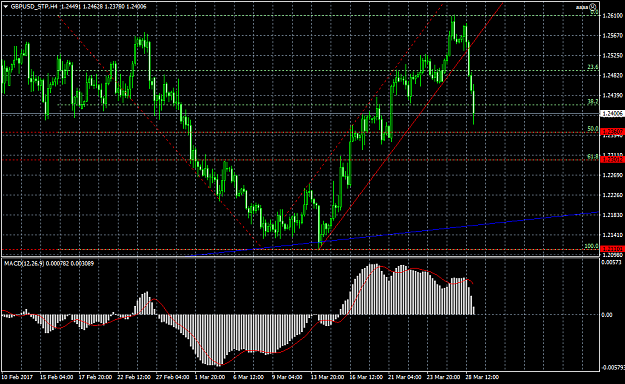
The price broke through the upper limit of the triangle formed within the descending channel on 1D time frame graph. It may be the beginning of a trend reversal. The price fixation above 1.29 (61.8% of the Fibo correction grid) is above the upper boundary of the downlink will be that confirmation.
Resistance Levels:
- 1.2580
- 1.2680-1.27 (50% Fibo)
- 1.2870-1.29 (61.8% Fibo)
- 1.3444 (High 2016.09.06)
Support Levels:
- 1.23
- 1.22
- 1.21
- 1.1950
Attached Image (click to enlarge)