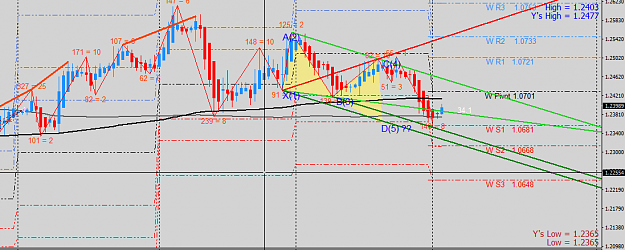
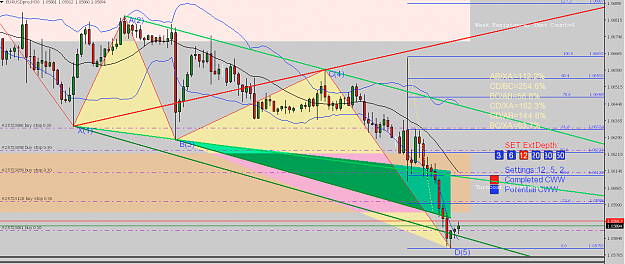
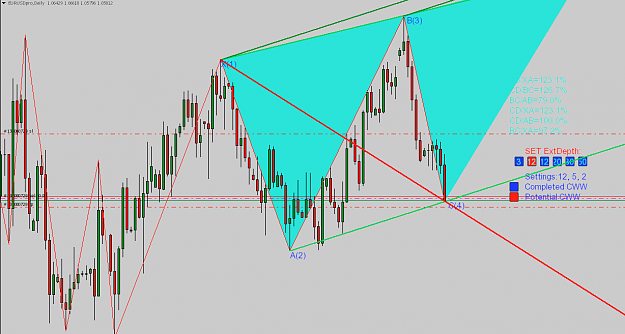
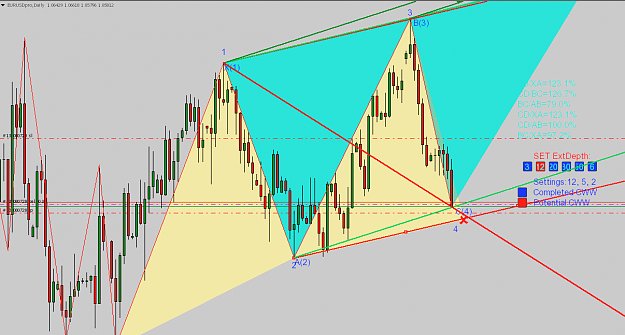
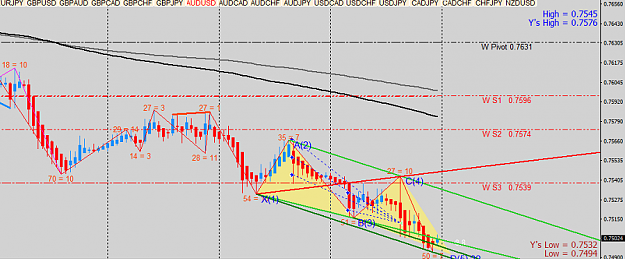
Disliked{quote} Very interestingly now, the indicator draw the same chart CWW as a completed CWW. I Believe it would be a profitable buy opportunity and a very good R/R ratio, if you put the SL just below the green line of the 2nd S.zone and TP somewhere above the A_C Line. This will give you a goal of >50 pips {image} And if you follow this in the Daily chart then there you see a potential CWW, just forming, and the D(5) will Complete this one, somewhere around above 300 pips of profit before it retrace, which i estimate it may take a week or two before...Ignored
I am crossing my fingers, Hopefully the prediction of future price movement will come true.
Attached Image (click to enlarge)
Also notice that the AB/CD ratio is 144%, and that D(5), has just past the 2nd S.Zone even, until it formed a new pivot point. May be confluence is playing a role here, (coincidence of the daily potential CWW, C(4)point, and this D(5), of the completed M30 CWW, on different TF). Or may be then it is not a typical CWW and it fits the definition of what is called "Bullish Alt AB=CD Pattern".
Please, please i ask, from those experienced trader and Expo to participate and give their comments on this topics. Don't let this forum to fade gradually in dark of silence, and let us all learn from each other.
![Click to Enlarge
Name: AUDJPY 170410 6H [1].png
Size: 86 KB](/attachment/image/2262475/thumbnail?d=1491766291)