• Home
  • Forums
  • Trades
  • News
  • Calendar
  • Market
  • Brokers
  • Login
  • Join
  • User/Email: Password:
  • 4:32pm
Menu
  • Forums
  • Trades
  • News
  • Calendar
  • Market
  • Brokers
  • Login
  • Join
  • 4:32pm
Sister Sites
  • Metals Mine
  • Energy EXCH
  • Crypto Craft

Options

Bookmark Thread

First Page First Unread Last Page Last Post

Print Thread

Similar Threads

Is Grid Trading (combined trend following and counter trend) Profitable? 3 replies

Making a good diversified portfolio 10 replies

Diversified EA Money Management Code 10 replies

HAMA PAD - A Simple Trading Approach 7 replies

Trading a (semi) automatic approach...but want more 11 replies

  • Commercial Content
  • /
  • Reply to Thread
  • Subscribe
  • 4,237
Attachments: Diversified Trend Trading Approach
Exit Attachments
Tags: Diversified Trend Trading Approach
Cancel

Diversified Trend Trading Approach

  • Last Post
  •  
  • 1 6364Page 656667 232
  • 1 Page 65 232
  •  
  • Post #1,281
  • Quote
  • Mar 26, 2017 10:47am Mar 26, 2017 10:47am
  •  Copernicus
  • | Commercial Member | Joined Apr 2013 | 4,362 Posts
Quoting jusiur
Disliked
{quote} Mr C, excellent PDF thanks, since you have the great ability to explain complex concepts so didactically, I ask you about the article and to put it in simple terms, how could the volatiliy, described by the author, be applied to daily trading ? is applicable? Moreover, how can a trader interpret volatility from the author's view in more flat terms? thanks
Ignored
Hi J

The article focusses on how the competetive efforts by the central Banks since the GFC and more particularly since 2010 have resulted in risk being transferred, magnified by government policy and further amplified by participant behaviour resulting in a 'surreal global economy' that has artificially high valuations and bearing massive levels of intrinsic risk. To trace where this risk actually lies however is a massive conundrum for any analyst due to the interconnected nature of our markets. The thing about complex systems such as the financial markets are that when inputs are supplied to such systems such as the gargantuan increase in monetary supply with no associated increased global productivity, growth in income equality and debt deflation, this input is quickly dissipated throughout the system across asset classes and is incredibly difficult to identify where it has been transferred to. The same occurred in 2008 where the impacts of toxic securitised mortage debt from the US were transferred by the holders of this toxic debt into the financial system and ended up in obscure places.

Despite the lessons of 2008, we really haven't learnt anything. The risk borne in the financial markets has grown significantly through quantitative easing policies. The too big to fail syndrome has not just been applied selectively, it is now a global policy applied by almost every Central Bank. As stated in the article, globally Central banks have printed over 14 trillion dollars since the end of the GFC and there has been a massive burst of competetion amongst the Central Banks to devalue their currencies to gain a competetive advantage. The result is that we have artificially high valuations of almost all asset classes you can think about......but still the money printing occurs.

The problem we face is that now there is nowhere to turn for the central banker or for the average investor. The Central Banks are too scared to pull the reigns in, and are in a prison of their own design.

Some of the symptoms we are facing now is a direct result of Central Bank policy. You may have noticed that volatility in the financial markets has been artificially suppressed. Furthermore you can see this suppression across all asset classes and their progressively building correlations. The reason for the growth in correlation across asset classes is the impact of this dramatic influx of worthless paper which needs to find a home in some asset class somewhere. Since 2010 mean reversion has reigned supreme with very limited volatility. The problem with this artificial suppression and a result of the markets bearing increased risk is that complex systems become more prone to fat tailed events. Furthermore participant behaviour has now been significantly influenced by the notion that they should buy every market dip and short every market spike with leverage as they are fully aware that government policy now reacts to market conditions as opposed to economic conditions and as a result, they can be confident that their actions wil be supported by the Central Banks. The predictable pattern of mean reversion is an attractive lure to traders *while it lasts* and government policy plus participant behaviour is leading to this predictability. HFT is capitalising on this predictable pattern....but the net effect of this predictable environment and associated predictable participant behaviour is a massive spiralling of risk in a non-linear way.

You can see the intrinsic risk buried in the financial system with the more and more frequent market outbursts we are experiencing. The VIX has recorded 5 supernormal 5 sigma events over the last 2 years. This is abnormal schizophrenic behaviour which is alarming many policy makers.

You are aware of Martingale systems J. Well what is happening today across the global markets is a massive Martingale event where intrinsic risk is building in the market. This can theoretically go on for a long time.... The Central banks have been doubling down, the market participants have been feeding on this frenzy and a growing storm event is building on the horizon.

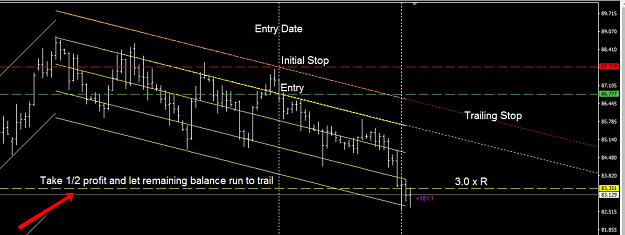
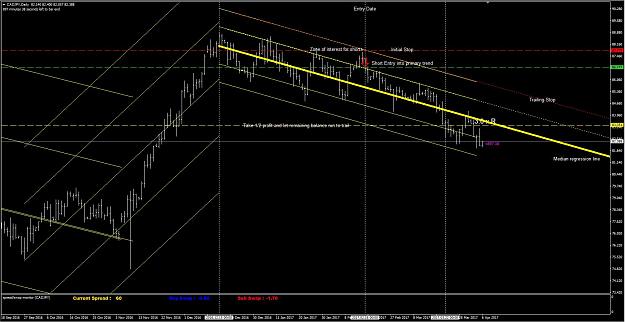
As a trend trader, while these conditions continue you need to have faith and stay the course. Continue to manage risk like the devil....but you need to be in it to win it. Do not lose the faith and throw in the towel. Crisis alpha is coming our way. We don't know when.....but the market conditions and symptoms are suggesting that our day in the sun is soon. There has been a massive divergence occurring between the real economy and the drug induced 'surreal economy' we face today. Today moral hazard is embedded in the markets.
 
4
  • Post #1,282
  • Quote
  • Mar 26, 2017 4:02pm Mar 26, 2017 4:02pm
  •  jusiur
  • Joined Oct 2010 | Status: Member | 646 Posts
Thanks Mr C for your time and detaliled answer.
Especially liked your last paragraph, conclusive words of encouragement to an excellent analysis.
Humble & Kalcker CLO2 = Covid killer
 
 
  • Post #1,283
  • Quote
  • Edited 10:13am Mar 27, 2017 8:05am | Edited 10:13am
  •  Copernicus
  • | Commercial Member | Joined Apr 2013 | 4,362 Posts
Inserted Video


Inserted Video
 
 
  • Post #1,284
  • Quote
  • Mar 27, 2017 11:35am Mar 27, 2017 11:35am
  •  HudithePfupf
  • Joined Mar 2016 | Status: Member | 653 Posts
post 1281.... great explanation.

I am on your page and I hope you can capitalize on it one day.

Regards, Hudi
 
 
  • Post #1,285
  • Quote
  • Mar 27, 2017 5:42pm Mar 27, 2017 5:42pm
  •  Copernicus
  • | Commercial Member | Joined Apr 2013 | 4,362 Posts
Quoting HudithePfupf
Disliked
post 1281.... great explanation. I am on your page and I hope you can capitalize on it one day. Regards, Hudi
Ignored
Cheers H :-)
 
 
  • Post #1,286
  • Quote
  • Apr 3, 2017 6:42am Apr 3, 2017 6:42am
  •  thomasK
  • Joined Oct 2011 | Status: Member | 209 Posts
To my friend C

Nothing to do with trading, but let us laugh a little with the way scientific papers are (usually) written...
Attached Image (click to enlarge)
Click to Enlarge

Name: arch.jpg
Size: 133 KB
Enter Signature
 
2
  • Post #1,287
  • Quote
  • Apr 4, 2017 5:32am Apr 4, 2017 5:32am
  •  Copernicus
  • | Commercial Member | Joined Apr 2013 | 4,362 Posts
Quoting thomasK
Disliked
To my friend C Nothing to do with trading, but let us laugh a little with the way scientific papers are (usually) written... {image}
Ignored

That gave me a good belly laugh T. Some great lines......"It is hoped that this study etc.etc........means "I quit"....LOL

PS.......A good article from Jack Schwager below on trend breaks and what you can do about them.

What You See Is Not What You Would Have Seen

Trend lines and channels are useful, but their importance is often overstated. It is easy to overestimate the reliability of trendlines when they are drawn with the benefit of hindsight. A consideration that is frequently overlooked is that trend lines often need to be redrawn as a bull or bear market is extended. Thus, although the penetration of a trend line will sometimes offer an early warning signal of a trend reversal, it is also common that such a development will merely require a redrawing of the trend line. For example, Figure 1 shows an uptrend line connecting the November and December 2012 lows in the Russell 2000 Mini futures. Prices remained above this line until February 2013, when prices closed below it, signaling an end to this move. Figure 2 extends Figure 1 by two months and shows that the February penetration of the original (dashed) trend line was a pullback that preceded a rally to a higher high. Prices remained above the revised (solid) trend line connecting the November and February lows until early April, at which point the market posted a more significant correction. Figure 3, however, shows the larger uptrend extended for almost another year, prompting three additional revisions to the uptrend line, each of which was necessitated by a closing penetration of the preceding trend line.

Attached Image (click to enlarge)
Click to Enlarge

Name: Figure 1.JPG
Size: 60 KB


Attached Image (click to enlarge)
Click to Enlarge

Name: Figure 2.JPG
Size: 68 KB


Attached Image (click to enlarge)
Click to Enlarge

Name: Figure 3.JPG
Size: 84 KB


Figure 4 provides a similar example for a downtrend. The initial downtrend line connecting the December 2014 and March 2015 highs (gray dotted line) was penetrated to the upside in June, but after a few weeks of sideways price action, the market resumed its decline. The revised trend line (thicker dashed line) connecting the December 2014 and June 2015 highs extended until November 2015, when prices again pushed higher—enough to require a third revision to the downtrend line (solid line), but not enough to end the longer-term downtrend.

Attached Image (click to enlarge)
Click to Enlarge

Name: Figure 4.JPG
Size: 72 KB


The preceding examples are meant to drive home the point that the penetration of trend lines is more the rule than the exception. The simple fact is that trend lines tend to be penetrated, sometimes repeatedly, during their evolution, which is equivalent to saying that trend lines are frequently redefined as they extend. The important implications of this observation are that trend lines work much better in hindsight than in real time and that penetrations of trend lines often prove to be false signals.

False Trend Line Breakouts

As we saw in the previous section, trend lines are particularly prone to false breakouts. Such false breakouts, however, can be used as signals for trading in the direction opposite to the breakout. In fact, in my opinion, false trend line breakout signals are considerably more reliable than conventional trend line breakout signals. In the case of a downtrend, a false trend line breakout would be confirmed if the market closed below the trend line a specified number of times (e.g., two, three) following an upside breakout. Similarly, in the case of an uptrend, a false trend line breakout would be confirmed if the market closed above the trend line a specified number of times following a downside breakout.

Figure 5 provides an example of a false breakout of an uptrend line in 10-year T-note futures. The September downside breakout of the uptrend line was soon followed by a break above the line. The indicated failure signal is based on an assumed requirement of two closes above the line for confirmation. Figure 6 provides a similar example in the E-mini Nasdaq100 futures.

Attached Image (click to enlarge)
Click to Enlarge

Name: Figure 5.JPG
Size: 73 KB


Attached Image (click to enlarge)
Click to Enlarge

Name: Figure 6.JPG
Size: 70 KB


It is quite possible for a chart to yield multiple successive false trend breakout signals in the process of a trend line being redefined. In Figure 7 the initial upside penetration of the prevailing downtrend line occurred in mid-March. Prices quickly retreated back below the line, with the indicated failure signal assumed to be triggered by the second close below the line. Another false breakout occurred about a month later based on the redefined trend line using the March relative high. Prices retreated below this downtrend line several days later, yielding another false trend breakout signal.

Attached Image (click to enlarge)
Click to Enlarge

Name: Figure 7.JPG
Size: 74 KB


This is the second in a series of articles that will be released approximately weekly that are based on extracts from the recently published
A Complete Guide to the Futures Market.


Cheers

C
 
2
  • Post #1,288
  • Quote
  • Apr 4, 2017 3:14pm Apr 4, 2017 3:14pm
  •  thomasK
  • Joined Oct 2011 | Status: Member | 209 Posts
Dear C

Some time ago I asked you in this thread " Do you feel that we - trend traders- sometimes leave a lot of pips "on the table" with our relatively wide range stops"?
Your answer was negative.

Recently I noticed this.

Can you please clarify a few things:

a. Did you always follow such a rule, or you implemented it recently?
b. Have you backtested it against just leaving the position being stopped out?

Can you please explain your thought process a bit?

Thanks in advance

T
Attached Image (click to enlarge)
Click to Enlarge

Name: 2017-04-04_2209.png
Size: 500 KB
Enter Signature
 
 
  • Post #1,289
  • Quote
  • Apr 5, 2017 9:04am Apr 5, 2017 9:04am
  •  Copernicus
  • | Commercial Member | Joined Apr 2013 | 4,362 Posts
Quoting thomasK
Disliked
Dear C Some time ago I asked you in this thread " Do you feel that we - trend traders- sometimes leave a lot of pips "on the table" with our relatively wide range stops"? Your answer was negative. Recently I noticed this. Can you please clarify a few things: a. Did you always follow such a rule, or you implemented it recently? b. Have you backtested it against just leaving the position being stopped out? Can you please explain your thought process a bit? Thanks in advance T {image}
Ignored
Hey T. I'm out and about for the next few days. Will get you a considered response to your good question on the weekend. Sorry for the delay.

Cheers C
 
 
  • Post #1,290
  • Quote
  • Apr 6, 2017 5:28am Apr 6, 2017 5:28am
  •  Copernicus
  • | Commercial Member | Joined Apr 2013 | 4,362 Posts
Quoting thomasK
Disliked
Dear C Some time ago I asked you in this thread " Do you feel that we - trend traders- sometimes leave a lot of pips "on the table" with our relatively wide range stops"? Your answer was negative. Recently I noticed this. Can you please clarify a few things: a. Did you always follow such a rule, or you implemented it recently? b. Have you backtested it against just leaving the position being stopped out? Can you please explain your thought process a bit? Thanks in advance T {image}
Ignored
T........ I have a moment so I can explain the logic applied to this variant.

The strategy you are referring to is the DTTR which is a retracement entry method of trend entry. This is a different method to the breakout techniques of the DTT, EDTT and EDTT1 that are also described in this thread. The DTTR combines a mean reverting element to a core trend following element and can be thought of as a combination of two broad approaches. A convergent approach (a move towards a historic mean in the short term) and a divergent approach (a move away from the historical mean in the long term).

Now normally I shy away from forms of mean reversion but the approach applied here is used to simply augment the returns of trend following and reduce the volatility of returns by supplementing trend following revenues with a bit of mean reversion or swing trade additions.

As you are aware T....under the traditional breakout approach of the methods described in this thread, they are more volatile and there can be long waits between drinks with building drawdowns. Now most trend followers have thick skin and can tolerate this as they rely on volatility over the long term to make their windfall......however given that we apply the DTTR over such a long timeframe..... often with holding periods of years, it is necessary for psychology and also to fund holding costs over these long term horizons to provide for cashflow along the way. That's where this variant of the core strategy of trend following comes to the rescue.

When referring to a retracement entry we are building in to the core trend following strategy a mean reverting component. The mean reversion is based on the assumption that on a longer term trend there are swing moves above and below the median regression line of the longer term trend (or price overshoots and undershoots along a directional drift).

On the AUDCAD example which is still active I have highlighted the median regression line of the primary trend with a thick yellow line. The outermost parrallel regression lines represent the maximum adverse excursion of price over the course of the defined trend that has been drawn from it's historical swing high or swing low. In the case of the AUDCAD the primary trend has been short according to this definition of trend since 15 Dec 2016. As a result we need to ensure that the SDC totally encapsulates the full extent of all adverse price moves since the last swing high or low. Now that we know according to this definition that our primary trend is short we will therefore only ever consider short entries in the direction of the primary trend. An adverse price move therefore is long in the context of the short primary trend. Vice versa if the primary trend is long.

Attached Image (click to enlarge)
Click to Enlarge

Name: Capture.JPG
Size: 191 KB


Having achieved this, the logic we use is that an extension of the outermost SDC line into the future represents an ideal trailing stop that once breached means that the trend according to this definition breaks down. As a result, when that rule is broken all trades are exited on the trailing stop.

Now in addition to the outermost lines and the median line, for a retracement entry we are waiting for price to retrace away from the median regression line in anticipation that it will revert back over time into the direction of the primary trend. More often than not, this represents a shorter term trend (swing moves) on a longer term trend.

For the purposes of this approach we therefore need to define when price is in an overbought or oversold condition with respect to the primary trend. We therefore add equidistant parrallel lines above and below the median regression line to define the zones of interest into which price needs to move before we consider any entries.

Once price moves into this zone, then we go on alert mode and wait until prive opens in this zone and then crosses below the zone of interest back in the direction of the primary trend as confirmation that a retracement is occurring. Your zone of interest line represents your entry (long or short) and your outer regression line is your initial stop and then trailing stop.

Now we effectively take two entries (0.25% each of trade capital). If price moves to 3 x R, we profit take on one position which injects cash into our pockets to fund future holding costs of the remaining position and also take advantage of high momentum moves in the direction of the primary trend. The remaining position held however is our potential gold mine that could run on for a year or two on one of those great secular trends. Now if after selling half the position at 3R price retraces again back into our zone of interest, we then top up with another 1/2 trade with the same rules to become full.y loaded again so hopefully we can grab another 3R profit when momentum in trend picks up again.

Now if we solely use this approach alone we clearly are going to miss some great trends as price may trend without ever retracing into these zones......however if they do, we can get razor sharp entries with tight stops and great position sizing that can offer great leverage if we are right. That's why I refer to this approach as a sniper approach to trend entry. Because I hate missing trends when they arise I would only consider this strategy as a supplement to the main game of breakout trend trading across multiple time-frames.....however as a system portfolio supplemement to the main game, it is a good additional system to include in the suite. It has less correlation than the other breakout systems, offers great cashflow and also some ripper long term rewards with the remaining trailing position.........but I still love my trusty breakouts over multiple timeframes simply because I ring-fence any trend oportunity using the breakout methods......and no trend gets away from me.

I hope this helps a bit T. Let me know if you want more info?

C

Inserted Video
 
4
  • Post #1,291
  • Quote
  • Apr 6, 2017 11:09am Apr 6, 2017 11:09am
  •  thomasK
  • Joined Oct 2011 | Status: Member | 209 Posts
Thanks C

Crystal clear!

T
Enter Signature
 
 
  • Post #1,292
  • Quote
  • Apr 7, 2017 3:13am Apr 7, 2017 3:13am
  •  Copernicus
  • | Commercial Member | Joined Apr 2013 | 4,362 Posts
Warming up for the weekend :-)

Inserted Video


Inserted Video


Inserted Video


Inserted Video


Inserted Video
 
 
  • Post #1,293
  • Quote
  • Apr 7, 2017 9:45pm Apr 7, 2017 9:45pm
  •  Copernicus
  • | Commercial Member | Joined Apr 2013 | 4,362 Posts
A balmy day of crunching data :-)

Inserted Video


Inserted Video
 
 
  • Post #1,294
  • Quote
  • Edited 7:31pm Apr 8, 2017 4:07am | Edited 7:31pm
  •  Copernicus
  • | Commercial Member | Joined Apr 2013 | 4,362 Posts
Let Them Eat Cake

Attached Image (click to enlarge)
Click to Enlarge

Name: Let them eat cake.JPG
Size: 48 KB


There are some expressions I simply don't like. One of them is the glib classification of the Managed Futures segment of the Fund Management World as an 'alternative investment class'. For some reason, people get it in their thick skulls that investments dominated by equities or bonds are the standard of the industry when in fact the risk weighted return metrics of the Managed Futures segment represent the gold standard of investment returns and should represent the dominant allocation made by any portfolio manager who is genuinely serious in delivering investors long term wealth.

Rather than rant on.....I thought I would take the time to demonstrate how a simple approach to portfolio management that restricts itself to the long term trend following CTA's can deliver consistent risk-weighted returns that dwarf the alternatives. You may ask why do I restrict myself to the trend following class of Managed Futures? Well for a start this class of investment opportunity is highly diversified, spanning across a diverse range of asset classes, timeframes and systems. As a result, some of the long term players in this space offer some of the best risk-weighted returns available in the Funds management segment attributed to their relative low correlated exposure to any investment class.

So how do we go about creating poweful portfolios in this space? The trick lies in sorting the chaff out from the wheat without adopting any hindsight measure. This post will unveil the secret but simple sauce of standing on the shoulders of these giants of the industry and creating powerful portfolio blends that offer stunning risk-weighted returns. You can throw your convoluted quantitative approaches and modern portfolio theory out with the bath water. It's time to get serious in the land of reality.

Let's Put our Chef's Hat on and make some Secret Sauce?

In a previous post I reported on the performance of the established Trend Following Fund Managers. "Why only the established long standing managers I hear you cry?"...... Well, to put it simply we are looking for the FM's that can demonstrate a proven track record.....not the loose promise of risk weighted returns from smart beta or a CTA replicator. It is easy in hindsight to create attractive return distributions....but a different kettle of fish to deliver them when you are trading on the right hand edge of the chart in the real world of trading. These established FM's have experienced risk of all forms over the course of their entire operation and have stood the test of time. Why settle on a Lada as opposed to a Rolls Royce?

In the performance appraisal we reviewed 55 diversified Trend Following Fund Managers who have been in operation at least since 2000 to the present day. This represents a nice long...ish timeframe that spans an array of market conditions and allows us to filter out those FM's that have delivered superior risk-weighted returns across a broad range of market conditions.

Below are the return distributions of the top 10 TF Managers that produced superior CAGR/Drawdown ratio's out of the total list of 55. You might remember me stating that this is my preferred risk-reward metric. While the sharpe or sortino ratio are useful as a short term measure.....on a long term basis it is the very tangible nature of a max drawdown which gives an investor an ulcer. While a drawdown in general can be attributed to a random sequence of unfavourable trades, long term drawdowns provide important information on the risk tolerance of a Fund Manager.

Return Distributions
Attached Image (click to enlarge)
Click to Enlarge

Name: Return Distributions.JPG
Size: 108 KB


The dotted white line in the chart above represents the S&P500TR Index. Note how each of the Top 10 have outperformed this equity index. Not only have they outperformed the S&P500TR in terms of raw CAGR returns but have achieved these returns with far lower volatility. Refer to the table below that highlights the CAGR and the maximum drawdown over the 17 year period.

CAGR versus Drawdown Table
Attached Image


Now I want you to refer back to the Return Distribution table above. In particular focus on that nice wide white equity curve that sits smack bang in the middle of the return distributions. This equity curve is referred to as the Top 10 Index. That's the solution we would like to have as our portfolio. This return distribution represents the result of an equal weighted blend of the top 10 performing FM's. Let's look at it's characterictics.

Attached Image (click to enlarge)
Click to Enlarge

Name: Top 10 Index.JPG
Size: 87 KB


This equity curve has the long term performance characteristics that we drool for. An annualised Sharpe of 0.98, a CAGR of 11.09% and a max drawdown over the 17 year period of only 9.35%. Just look at that steeply rising equity curve that is reaching for the stars. If we should be so lucky!!!

Ok....after you have picked your jaw off the floor, we now want to find out how we can apply a bit of sound logic to achieve a similar outcome without the benefit of hindsight. The chances of picking these exact 10 funds out of the 55 existing plus the remaining FM's in January 2000 who have gone the way of the Dodo since then would be small to say the least.....but let's apply some of that grey matter in our skull to find a way to get close.

It's the Year 2000

Let's go back in time to the heady year of 2000 to see what our options were then. We have just emerged unscathed from the dreaded Year 2K crisis and are ready to rumble. We have our funds for allocation from Daddy in our hot hands and are eager to get cracking.

The rules we will apply are simple. We will only select our ingredients from established trend followers and we will further restrict ourselves to the top 10 in the CAGR/ Drawdown list of offerrings and undertake an annual assessment. Over the course of time, the selection will progressively more closely approximate that of our target outcome (namely the current top 10 list).

Now unfortunately this method of selection will necessitate that we periodically rotate the top 10 list of the time to reflect the best performers of the day and thereby incur exit and entry costs of rotation....but there is really no way around this small obstacle. What we want to avoid however are excessive roll costs. That's why we only consider rolling on an annual basis. We also only roll from one FM into another when a new fund pops up into the top 10 list. Furthermore in diversified portfolios such as these, you want to avoid rebalancing like the plague. It simply is not necessary and will eat into your return distributions.

So what were our options back then when we had a full head of hair and a 6-pack. We had 55 hard working FM's in total to choose from, so which ones did we select? Well we used exactly the same principle of applied logic. We ranked the options in terms of their CAGR/Drawdown performance for the 1999 year. The table below is the outcome.

Attached Image


So this is how we started. With an equal weighting applied to each FM. We then took our 365 year holiday on a yacht in the Mediterranean while the FM's were assigned to do all the hard work. Sailing is so exhausting by the way.

So up came the December of 2000 and we arrived back to our office with a great sun-tan, pearl white teeth and expensive sandals and sent a few emails to our wives about the hard slog we endured ensuring our investment mandates were met. What was worse we had to spend the next hour or so reassessing our portfolio to identify the top 10 list we would use for 2001. This was interrupting our planned early departure in the heli to Hawaii.

Here are the performance results of 2000 and the list of candidates selected for 2001 based on the top ten performers for 2000. In a nutshell, we commenced with an allocation of $10M and ended up with $12.07M after unfortunately having to rotate the entire top 10 list. If you have issues with the detail of minimum investments then multiply everything x 10. It is the theory that's important here.

Attached Image (click to enlarge)
Click to Enlarge

Name: 2000_2001 Listing.JPG
Size: 156 KB


Now this process just went on and on each year and I won't bore you with the details, however it is important to note that over the course of time, the need for FM rotation significantly reduced as we progressed towards the optimal mix. Needless to say, our fictional net wealth grew almost faster than our expanding egos....and that's after we parted with those 2:20 fees everyone is so eager to dilute today...cause life's so unfair!!!!. Here is a listing of the FM's that did the heavy lifting over the years.

Attached Image (click to enlarge)
Click to Enlarge

Name: Heavy Lifting.JPG
Size: 203 KB


To spare you all the pain of a year by year story. Here are the results of all our hard fictional work.

A CAGR of 7.09% and a max drawdown of 11.88%. I can live with that.

Attached Image (click to enlarge)
Click to Enlarge

Name: Rotated Fund Blend Conservative.JPG
Size: 95 KB


Sure the result pales a bit against the mighty white line of the Top 10 Index given the impacts of fund rotation but beggars can't be choosers.

So the moral of this story is.......leverage off the hard work of the CTA's out there who have a proven track record. Let them do the hard yards as you work out ways to spend your hard earned money in exotic lands. Investing doesn't have to be difficult you know.......you can cheat and use the skills and resources of others while you listen to music.

Inserted Video


Aveagreatweekend.

C
 
1
  • Post #1,295
  • Quote
  • Apr 8, 2017 5:19am Apr 8, 2017 5:19am
  •  Edorenta
  • Joined May 2014 | Status: Work in progress | 245 Posts
Quoting Copernicus
Disliked
Let Them Eat Cake
Ignored
Hi Copernicus,
Some interesting insight out there, much appreciated
You'll always miss 100% of the shots you don't take.
 
 
  • Post #1,296
  • Quote
  • Apr 8, 2017 5:43am Apr 8, 2017 5:43am
  •  Copernicus
  • | Commercial Member | Joined Apr 2013 | 4,362 Posts
Quoting Edorenta
Disliked
{quote} Hi Copernicus, Some interesting insight out there, much appreciated
Ignored
No Probs Ed :-)
 
 
  • Post #1,297
  • Quote
  • Apr 8, 2017 6:01am Apr 8, 2017 6:01am
  •  At777
  • | Joined Dec 2016 | Status: Member | 32 Posts
Copernicus, That picture of an old painting looks distinctly like Emilie du Chatelet (I had to edit this, the FF reply box didn't allow special text accent characters on Emilie's name). Wonder how her old pal, Voltaire, is doing these days? Haven't heard from Galileo Galilei, lately, nor Alhazen. Keep up the great Copernicanism work! And may the Great Fibonacci Pip God bring you many, many green pips.
 
 
  • Post #1,298
  • Quote
  • Apr 8, 2017 6:02am Apr 8, 2017 6:02am
  •  Nijee
  • | Joined Dec 2010 | Status: Audentes Fortuna Juvat | 169 Posts
Now that we are back on Qld time;

Inserted Video
Audentes Fortuna Juvat
 
 
  • Post #1,299
  • Quote
  • Apr 8, 2017 6:10am Apr 8, 2017 6:10am
  •  Copernicus
  • | Commercial Member | Joined Apr 2013 | 4,362 Posts
Quoting At777
Disliked
Copernicus, That picture of an old painting looks distinctly like Emilie du Chatelet (I had to edit this, the FF reply box didn't allow special text accent characters on Emilie's name). Wonder how her old pal, Voltaire, is doing these days? Haven't heard from Galileo Galilei, lately, nor Alhazen. Keep up the great Copernicanism work! And may the Great Fibonacci Pip God bring you many, many green pips.
Ignored
Cheers At777. Good to hear about my old pals...though I have been a bit busy lately in my monastery working out how to throw a spanner in the works about planetary motion. I'm just so bored these days. C
 
 
  • Post #1,300
  • Quote
  • Apr 8, 2017 6:13am Apr 8, 2017 6:13am
  •  Copernicus
  • | Commercial Member | Joined Apr 2013 | 4,362 Posts
Quoting Nijee
Disliked
Now that we are back on Qld time; https://youtu.be/ugA5bLqivkY
Ignored
About time too....you sluggard from the south :-)

Inserted Video
 
 
  • Commercial Content
  • /
  • Diversified Trend Trading Approach
  • Reply to Thread
    • 1 6364Page 656667 232
    • 1 Page 65 232
0 traders viewing now
  • More
Top of Page
  • Facebook
  • Twitter
About FF
  • Mission
  • Products
  • User Guide
  • Media Kit
  • Blog
  • Contact
FF Products
  • Forums
  • Trades
  • Calendar
  • News
  • Market
  • Brokers
  • Trade Explorer
FF Website
  • Homepage
  • Search
  • Members
  • Report a Bug
Follow FF
  • Facebook
  • Twitter

FF Sister Sites:

  • Metals Mine
  • Energy EXCH
  • Crypto Craft

Forex Factory® is a brand of Fair Economy, Inc.

Terms of Service / ©2023