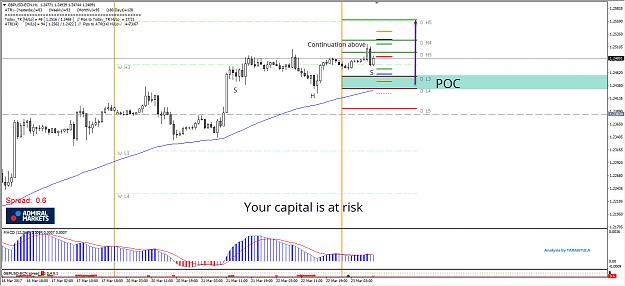
EUR/USD
4 hour https://fxmedia.s3.amazonaws.com/art...03-2017eu4.png
The EUR/USD broke below the rising wedge chart pattern (red/green) trend lines without breaking the resistance top (red), which means that the wave 2 (purple) has not been invalidated as yet. The EUR/USD is now testing the next support (blue) level which is part of a larger uptrend channel (blue/red lines).
1 hour https://fxmedia.s3.amazonaws.com/art...03-2017eu1.png
The EUR/USD could be a in a bearish wave 3 (blue) if price manages to break below the support trend line (blue). A break above the resistance trend line (orange) could see price retest the resistance zone (red).
Dear Traders,
Do you look at the charts and wonder how much to zoom in or out?
It's a valid question that deserves our time and attention today.
This article will discuss the pros and cons of using zoom, but we'll also discuss best equilibrium for chart viewing.
We will review the impact of zoom on traders view and perceive the charts first of all. https://fxmedia.s3.amazonaws.com/art...rs-New3-17.jpg
What's the impact of zoom?
How traders view the Forex, CFD and financial markets can be substantially different depending on how much traders zoom into or away from the chart. Please realise that the price action itself does not change in any way shape or form. It is our view of price that changes with the level of zoom.
Simply put, price always remains the same but a trader using zoom will change their perception. For instance, a trader who zooms into the maximum will see the least price action available from that time frame.
When trader zooms into the chart then they are in fact making time more "spacious", which means that less history is visible. In other words, the left side of the chart reveals less of the past - see image below for an example. https://lh3.googleusercontent.com/6H...hqqRXCSvjXkLET
The opposite happens when traders zoom out when viewing their charts. The same time frame from the same currency pair in the Forex market, however, looks totally different when a trader zooms out as much as possible.
Candles have less distance between each other, and the chart is squeezed closer. The left side of the graph goes further into the past and more history is revealed, which can impact the price axis as well (if price auto adjusts to the top and bottom of the visible candles). See image below for an example. https://lh4.googleusercontent.com/rY...5QPN4FcSV4mQ4t
Trader tip #1: there are two ways to change the zoom. One way is to click on the minus-magnifying glass sign to zoom in and the plus-magnifying glass sign to zoom out. The other way is to click anywhere in the time scale (at the bottom) and drag to the left to zoom out or drag to the right to zoom in.
Trader tip #2: you can check
EUR/USD
4 hour https://fxmedia.s3.amazonaws.com/art...03-2017eu4.png
The EUR/USD indeed continued with the uptrend yesterday by breaking slightly above 1.09. Price has bounced at the 61.8% Fibonacci target of wave C (green) could extend towards the 100% Fibonacci target near the psychological round level of 1.10.
1 hour https://fxmedia.s3.amazonaws.com/art...03-2017eu1.png
The EUR/USD indeed completed a bullish wave 3 (orange) as indicated yesterday. A bearish retracement for a wave 4 (orange) seems likely at the moment and the Fibonacci levels of wave 4 vs 3 could act as support. A break below the 61.8% Fib makes a wave 4 less likely and a break below the channel invalidates it.
GBP/USD
4 hour https://fxmedia.s3.amazonaws.com/art...03-2017gu4.png
The United Kingdom (UK) has officially and formally triggered Article 50 on Wednesday 29 March 2017, which starts the British exit (Brexit) out of the European Union. The process and negotiations will last 2 years and the UK is set to leave the EU by 29 March 2019.
The GBP/USD is building a small triangle (red/green lines) pattern. The wave WXY (orange) could be part of a wave X (blue) which is part of a larger WXY (blue) to complete a wave E (green) triangle.
1 hour https://fxmedia.s3.amazonaws.com/art...03-2017gu1.png
The GBP/USD is building a potential ABC (pink) zigzag within wave X (orange). A break above resistance (red) could see price move towards the targets.
GBP/USD
4 hour https://fxmedia.s3.amazonaws.com/art...04-2017gu4.png
The GBP/USD broke above the resistance of the triangle (dotted orange) chart pattern, which makes it likely that a wave X (blue) has been completed. Price could be building a wave Y (blue) correction towards the Fibonacci targets.
1 hour https://fxmedia.s3.amazonaws.com/art...04-2017gu1.png
The GBP/USD broke above the resistance trend line (dotted orange). The breakout will probably turn out to be an ABC zigzag (pink). The trend lines are forming a contracting chart pattern and the current formation could be part of a wave 4 (purple) retracement.
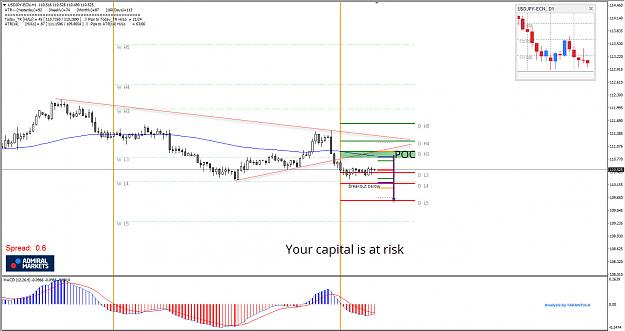
USD/JPY
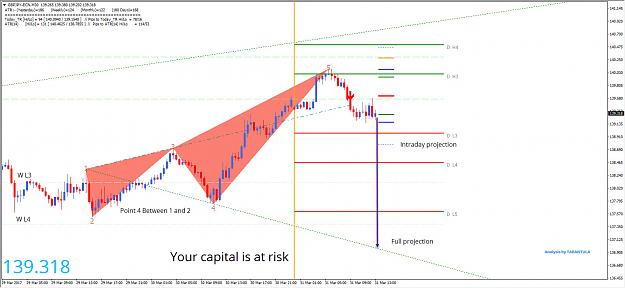
4 hour https://fxmedia.s3.amazonaws.com/art...04-2017uj4.png
The USD/JPY broke below the support trend line (dotted blue) and is now testing the next support (green). A bounce and break above resistance (red) could indicate that wave X (orange) has been completed whereas a break below the 138.2% Fibonacci level invalidates wave X (orange).
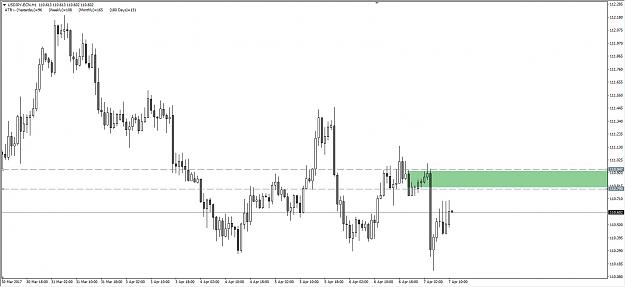
1 hour https://fxmedia.s3.amazonaws.com/art...04-2017uj1.png
The USD/JPY break above the 61.8% Fibonacci level invalidates wave 4 (pink). A final wave 5 (pink) after a wave 4 (pink) retracement could for instance bounce at the 100% Fib level of wave X vs W (orange) and 110 psychological round level.
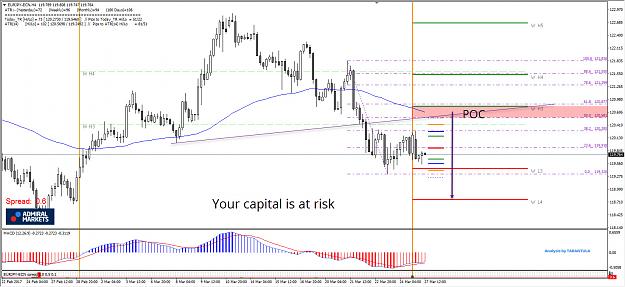
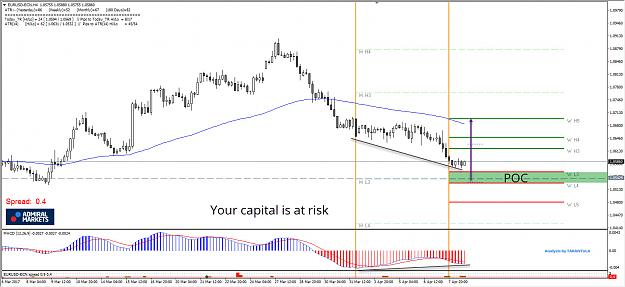
EUR/USD
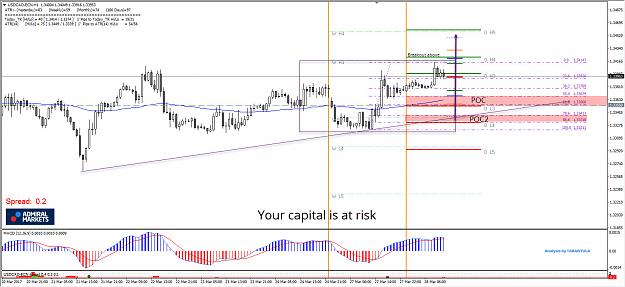
4 hour https://fxmedia.s3.amazonaws.com/art...04-2017eu4.png
The EUR/USD is struggling to show momentum in either direction and has decided to move sideways. When looking at the divergence visible on the hourly chart, it seems more likely that a wave 2 or B retracement will occur but a break above resistance is needed to confirm.
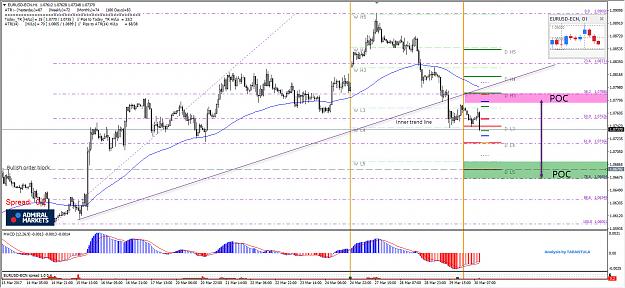
1 hour https://fxmedia.s3.amazonaws.com/art...04-2017eu1.png
The EUR/USD 1 hour chart is showing a heavy double divergence between the bottoms of price and the oscillator (green lines). The downtrend has lasted 300 pips but could now be in serious danger of a retracement if price manages to break above resistance (red).
The wave count could still be in a wave ABC (orange) because it did not break below the 138.2% Fibonacci level of wave B vs A (orange). A break below that level indicates a downtrend continuation whereas a break above resistance (red) could spark a wave C (orange).
- Your capital is at risk
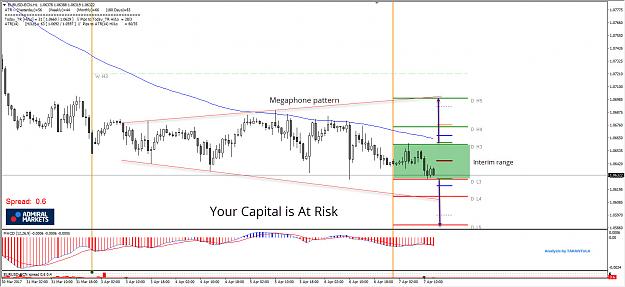
GBP/USD
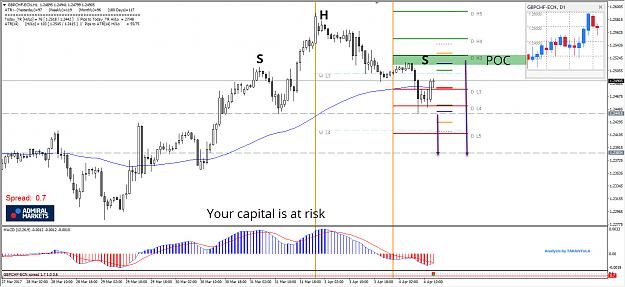
4 hour https://fxmedia.s3.amazonaws.com/art...04-2017gu4.png
The GBP/USD is building a contracting triangle chart pattern (red/blue lines). A break above resistance (red) could see price complete wave E (green). A break below support (blue) could see price challenge the 61.8% Fibonacci level of wave X vs W (blue).
1 hour https://fxmedia.s3.amazonaws.com/art...04-2017gu1.png
The GBP/USD is probably still in a larger ABC zigzag (pink) within wave X (blue) as long as price does not break the resistance (red) trend line. Price is also at an even 1.25 resistance level. A break below support (blue) could spark the wave C (pink) part of the expected bearish zigzag.