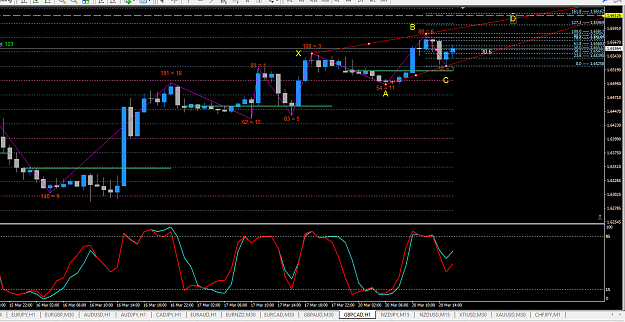
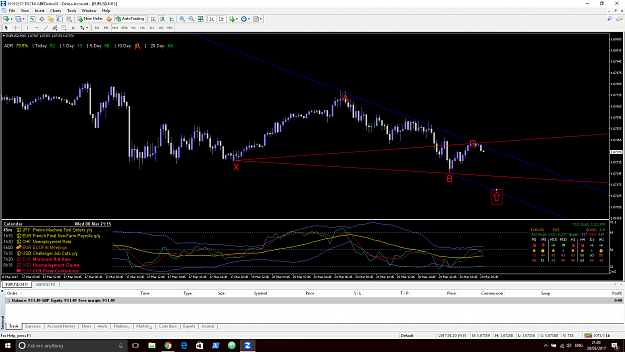
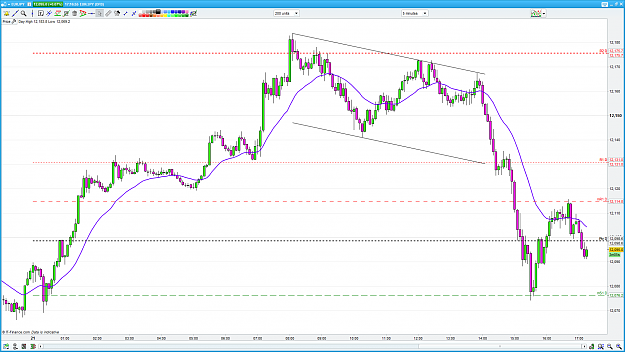
Hi Expo, in a situation like this (EJ 1H) with a possible AB=CD completion right at the BRN 120.00, where would you start scaling? As said, I'm not used to go counter trend and that would make me start scaling at 161.8 ext down to the BRN but maybe it's too conservative?
Thanks
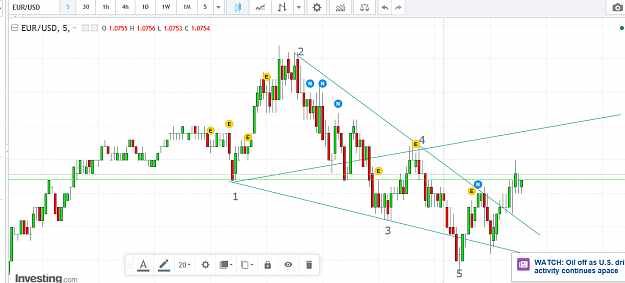
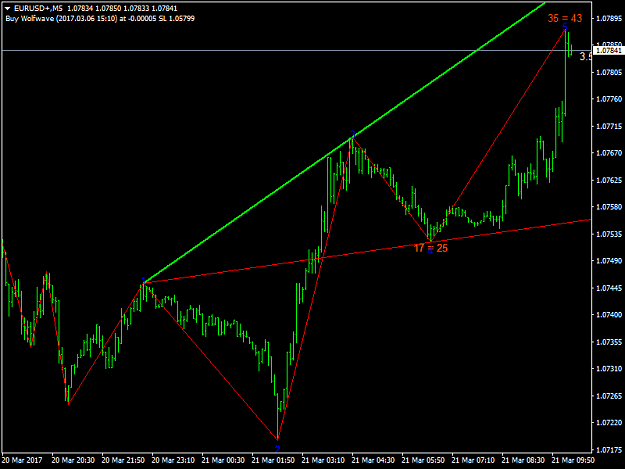
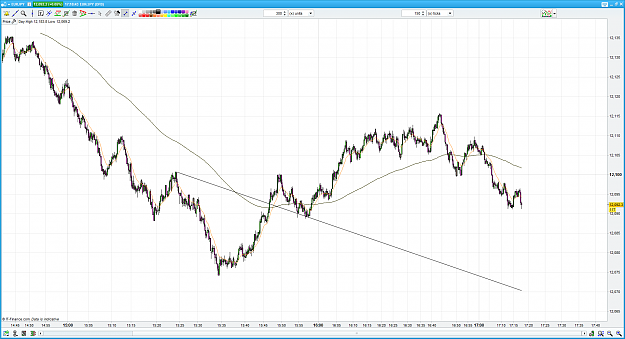
ARGH im confused. Do we have a simplified of a bullish chart? Im trying to compare my thinking but all my charts are bullish and the 1st page only shows a bearish rules. How do I workout where C goes?
Hi Expo, in a situation like this (EJ 1H) with a possible AB=CD completion right at the BRN 120.00, where would you start scaling? As said, I'm not used to go counter trend and that would make me start scaling at 161.8 ext down to the BRN but maybe it's too conservative? Thanks {image}
Ignored
Hi Lm
I wouldn't be scaling in until the 200FIB. I zoomed out to show the strong support at 120. If price makes it down that far, you can imagine there will be a lot of demand heading into the 120 area. I would start scaling in with very small positions first. Hopefully the chart is self explanatory.
Well spotted wave though and best of luck with this trade if it happens
Pride always comes before destruction.... -Proverbs 16:18
Unfortunately I have about 12 hours of commitments until tomorrow morning so I will be away from the screen.
Yesterday I took a bit hit on a losing oil trade. Was on the phone blabbering away as I entered the trade and completely had my settings wrong for my risk parameters. On top of that, I had my SL on the wrong side of the FIB that was in play. As a result, instead of a small loss, it cost me a draw down far beyond my risk profile.
Lesson learned, "hands free" device doesn't mean your brain is free to focus on the task at hand!! Foolish mistake on my part. Trading is hard enough as it is without making careless mistakes.
Anyways, the only thing I have going is the EUR/USD short from last week. Hopefully we can break the 1.0725 area and gets some more downward momentum
Thanks for all of the great post ladies and gents. I am anxious to read through all of them when I get home tomorrow
Pride always comes before destruction.... -Proverbs 16:18
ARGH im confused. Do we have a simplified of a bullish chart? Im trying to compare my thinking but all my charts are bullish and the 1st page only shows a bearish rules. How do I workout where C goes? Is this correct ? {image}
Ignored
im on my phone at the moment so I can't help much but if you look at the PDF overview in post #1 you will see examples of both bullish and bearish WWs.
Pride always comes before destruction.... -Proverbs 16:18
{quote} Hi Lm I wouldn't be scaling in until the 200FIB. I zoomed out to show the strong support at 120. If price makes it down that far, you can imagine there will be a lot of demand heading into the 120 area. I would start scaling in with very small positions first. Hopefully the chart is self explanatory. Well spotted wave though and best of luck with this trade if it happens
Ignored
Thanks for your reply Expo, my concern was in fact the likely push toward the BRN.
Quote
Disliked
ARGH im confused. Do we have a simplified of a bullish chart? Im trying to compare my thinking but all my charts are bullish and the 1st page only shows a bearish rules. How do I workout where C goes?
Is this correct ?
It's not correct, if you scroll the pages you'll find many bullish/bearish example. Just one tip, if it's an ascending WW like the one in your post, it's a bearish pattern and that means point X must be a swing high. Hope this helps
{quote} If I correctly read your chart, it doesn't seem a WW. In a descending pattern X should be a swing low and it's always between points B and C.
Ignored
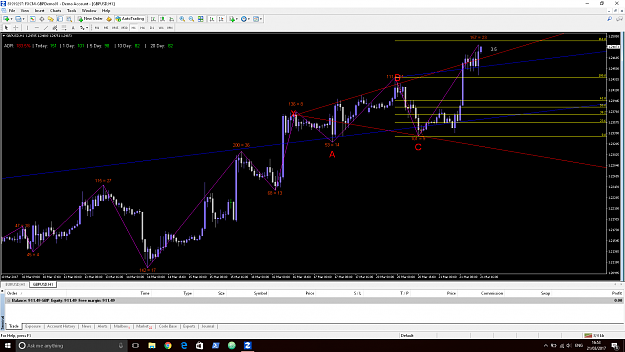
Yes, the lines are not converging you are correct. Point 4 in this case it above point 2 and therefore I accept that this is not a standard wave.
Apart from the fact that the SPTRD (US500) was selling off at the time, the context was good for a reversal up given that we were at the bottom of a bear channel whilst at the bottom of a broader bull channel - therefore a duelling lines pattern and a confluence of support. An expanding triangle had also just completed and that is trading range price action so I was looking for additional reasons to enter long at the bottom of the trading range. As we now know, the ftse sold off and it was a losing trade.
{quote} Yes, the lines are not converging you are correct. Point 4 in this case it above point 2 and therefore I accept that this is not a standard wave. Apart from the fact that the SPTRD (US500) was selling off at the time, the context was good for a reversal up given that we were at the bottom of a bear channel whilst at the bottom of a broader bull channel - therefore a duelling lines pattern and a confluence of support. An expanding triangle had also just completed and that is trading range price action so I was looking for additional reasons...
Ignored
I must have misunderstood your chart, that's not what I was saying. In any case sorry it was a losing trade.