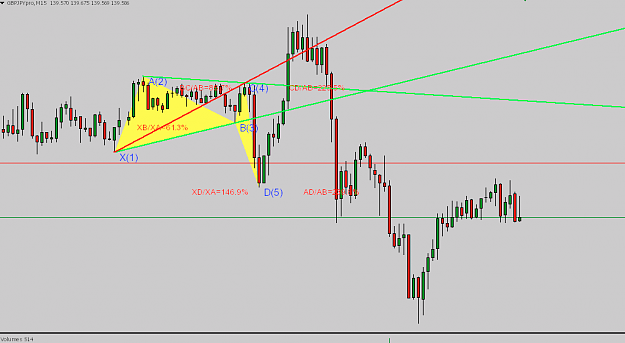
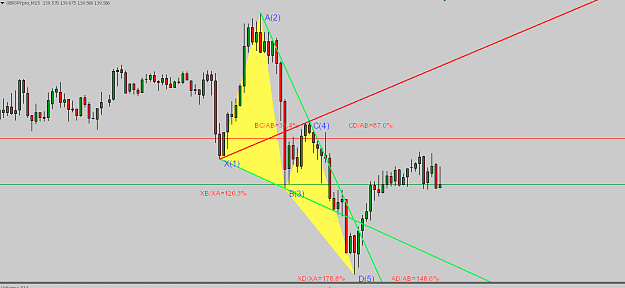
Is this valid?? My first analysis actually. Apologizing in advance if anything wrong. {image}
Ignored
Hello Niaz, welcome to forex factory.
Thanks for using the template and for clearly marking everything out. It helps me a lot as my eyes are very sensitive.
I never want to dissuade someone from taking or not taking a trade as I certainly don't have all the answers but there are a couple of things I see with this trade that may present a problem.
First off, when I mapped this out it shows that XB is actually a bit less than parallel, so structurally this wave isn't technically valid. Not a deal breaker but certainly something to be aware of.
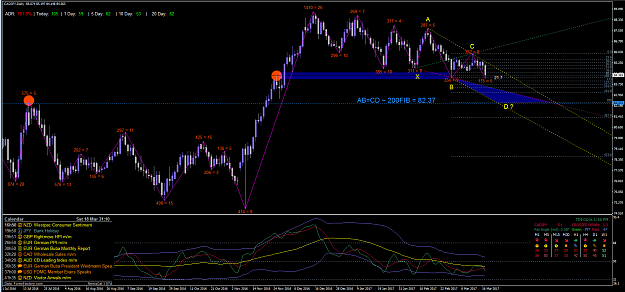
More importantly, there is a subsequent new wave developing here. Notice right now price is at a minor resistance, and then notice that the major resistance falls exactly where this new wave completes at the AB=CD level. I tried to make it clear on the chart. Also interesting is the spot where price reversed on your initial wave, exactly at point C of the new wave. Probably not a coincidence.
CAD/JPY DAILY CWW
Attached Image (click to enlarge)
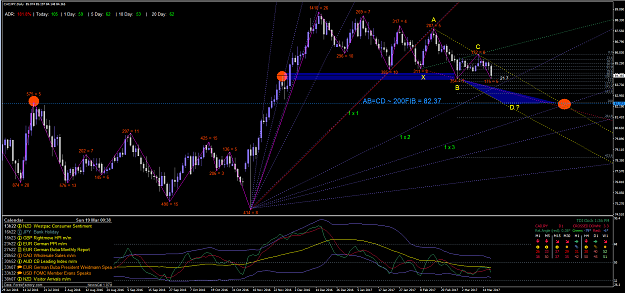
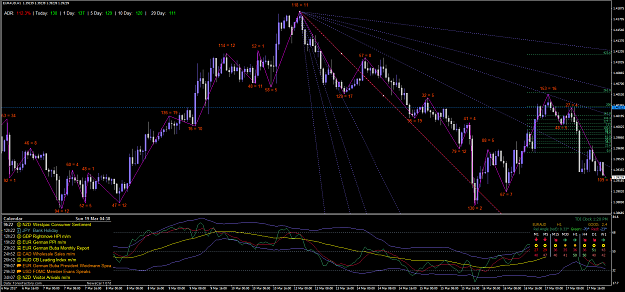
I'll preface this next chart by saying I am in my infancy in studying Gann angles. One thing I do know is they supposedly work better on higher time frames. Gann angles are unique in that they map out price AND time. I put a Gann angle on our chart and it seems to paint an interesting picture.
Gann theory says that when price breaks through one angle it is likely to continue to the next angle. In our scenario the 1x1 (45 degree) angle has been broken and price is heading towards the 1x2 angle. Interesting to note on our new wave that the 1x3 Gann angle crosses very near the ETA (Estimated Time of Arrival), which just happens to be near the 200FIB AND AB=CD completion level. Is price heading down to that point of confluence? I don't know but if it breaks through the 1x2 Gann angle, it could be.
Here is the same chart as above but with the Gann angles shown
CAD/JPY DAILY CWW WITH GANN ANGLES
Attached Image (click to enlarge)
Anyways ,that's my analysis for the chart you posted. I hope it helps in some way. Thanks again for posting and good trading to you. Please feel free to post any charts that you have questions about or anything else you want to share with us.
Regards,
-Kurt
Pride always comes before destruction.... -Proverbs 16:18
{quote} Just added option for drawing Triangles, to the indicator... hope it would be more helpfull. {file}
Ignored
Hi Parviz.
Thanks for sharing this indicator. A couple of questions for you
1) Are you at liberty to share the code source as I would love to modify the line thickness and color, etc
2) Does the indicator only show the wave after completion? I'm wondering at what point the indicator decides the wave is complete? The reason I ask is because I draw all my waves free hand and tend to scale into my positions as price is heading towards the completion level. So I like to be prepared to execute before the wave actually completes. I know many others wait for a candle reversal or TDI cross for confirmation so this indicator would be very useful to them. Of course, I think it's important for traders to be able to map out the waves free hand as it is a good point for learning the structure.
3) When I tested it on some charts it only shows the wave that has presently completed? Is that true?
Looking forward to you thoughts. Thanks again for sharing with us. Certainly the best functioning WW indicator I have ever tried
Regards,
-Kurt
Pride always comes before destruction.... -Proverbs 16:18
Hi : On the bases of the WW criteria this example is a bad failure ...? Am i wrong? {image}
Ignored
Well according to WW theory the actual wave would have been complete long before where the indicator shows point D. That's why I asked in my previous post how the indicator decides where the wave is complete because in this example the D point doesn't remotely line up with the sweet zone theory.
Pride always comes before destruction.... -Proverbs 16:18
Hi : On the bases of the WW criteria this example is a bad failure ...? Am i wrong? {image}
Ignored
Well according to WW theory the actual wave would have been complete long before where the indicator shows point D. That's why I asked in my previous post how the indicator decides that the wave is complete because in this example the D point doesn't remotely line up with the sweet zone theory
Pride always comes before destruction.... -Proverbs 16:18
What do you think? NZDCAD weekly. AB=CD. AC = BD. Expecting retracement .9475 ( 50%) to .9545 (76%). {image}
Ignored
Certainly harmonic in nature but not a Wolfe wave. With all due respect, I'm trying to keep the focus here on WWs. There a couple of really good threads on FF that focus on the more complex harmonic patterns
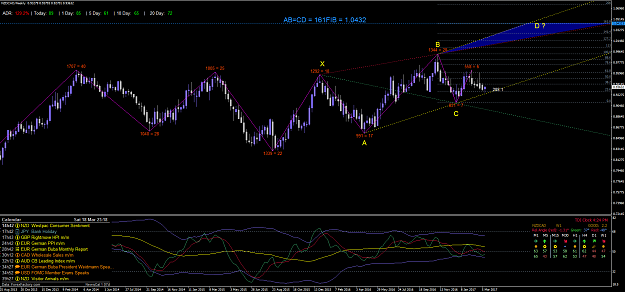
Ironically, I had been tracking a very nice CWW on the NZD/CAD weekly but the structure, although still valid, started to break down over the last month.
NOTE: The confluence between the AB=CD completion level and the 161FIB is pretty amazing, especially for a weekly chart!
NZD/CAD CWW WEEKLY
Attached Image (click to enlarge)
Pride always comes before destruction.... -Proverbs 16:18
{quote} Certainly harmonic in nature but not a Wolfe wave. With all due respect, I'm trying to keep the focus here on WWs. There a couple of really good threads on FF that focus on the more complex harmonic patterns Ironically, I had been tracking a very nice CWW on the NZD/CAD weekly but the structure, although still valid, started to break down over the last month. NOTE: The confluence between the AB=CD completion level and the 161FIB is pretty amazing, especially for a weekly chart! NZD/CAD CWW WEEKLY {image}
Ignored
My apology. I am that expert in WW. Maybe you don't intend this forum to be WW beginners. If that's the case, just point it out. I will be glad to WO from this discussion.
{quote} Certainly harmonic in nature but not a Wolfe wave. With all due respect, I'm trying to keep the focus here on WWs. There a couple of really good threads on FF that focus on the more complex harmonic patterns Ironically, I had been tracking a very nice CWW on the NZD/CAD weekly but the structure, although still valid, started to break down over the last month. NOTE: The confluence between the AB=CD completion level and the 161FIB is pretty amazing, especially for a weekly chart! NZD/CAD CWW WEEKLY {image}
Ignored
On second thought. I unsubscribe. Think it will save time rather than be here. GOOD BYE.
{quote} My apology. I am that expert in WW. Maybe you don't intend this forum to be WW beginners. If that's the case, just point it out. I will be glad to WO from this discussion.
Ignored
Hi Frx, I hope you weren't offended
This thread is for anyone interested in WWs, beginner or expert. Maybe I misunderstood your post. I was just trying to say that what you posted wasn't a Wolfe wave. I wasn't sure if you knew that or if you were just posting a different harmonic structure for discussion.
I just want the focus to be on WWs and not on the other more complex harmonic patterns. I just think it may confuse new traders that aren't well versed in this area.
Please feel free to post anything that you think may be a WW and we are all happy to disucss
Pride always comes before destruction.... -Proverbs 16:18
{quote} Hi Frx, I hope you weren't offended This thread is for anyone interested in WWs, beginner or expert. Maybe I misunderstood your post. I was just trying to say that what you posted wasn't a Wolfe wave. I wasn't sure if you knew that or if you were just posting a different harmonic structure for discussion. I just want the focus to be on WWs and not on the other more complex harmonic patterns. I just think it may confuse new traders that aren't well versed in this area. Please feel free to post anything that you think may be a WW and we are...
Ignored
keep up your approach. Remember you can't please everyone in the world. Focusing only on wolfe wave is good for the progress of this thread.
{quote} keep up your approach. Remember you can't please everyone in the world. Focusing only on wolfe wave is good for the progress of this thread. Keep the positive vibes here going!!!
Ignored
Thanks brother.
Well, we made it over 400 posts before our first awkward moment. I think maybe something was lost in the translation. Onward we go!
By the way, I will be flying to Florida for vacation on the 23rd and getting on a Royal Caribbean cruise ship with my 5 year old daughter. I am meeting some family that winters down in Florida. I will be totally off line during the cruise from the 25th to the 30th. The rest of the time I will only be able to view this thread from my phone as I promised the family I wouldn't bring my laptop with me. Back home on April 2nd.
Bottom line, I hope the thread stays at least somewhat active. I trust you'll step up your game
This thread has blessed me tremendously. I think I have learned more since I started this thread than I have in the past 3 months
Pride always comes before destruction.... -Proverbs 16:18
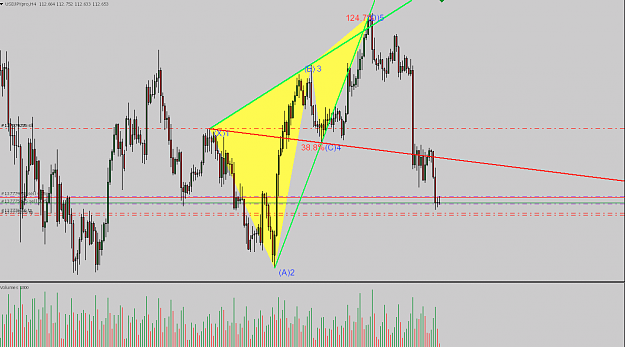
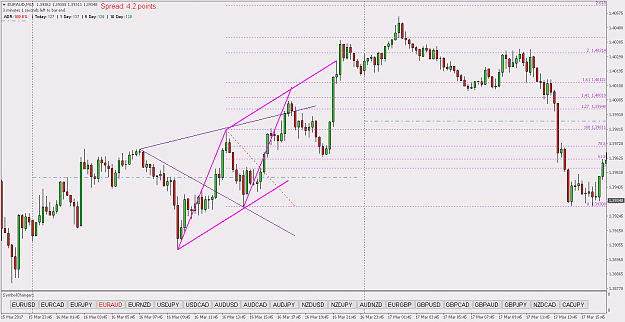
Consider this a failed example? Or stoploss not wide enough?
Edit: I just found out that if the start of C leg is robust or very volatile, it's usually bad for the CD leg or it may extend longer
CD LEG VARIATIONS
These CD leg phenomena can be described in four ways:
1.
If after point C has occurred a gap exists in the direction of point D,
this usually indicates that the CD leg will be much greater than the AB
leg—1.272, 1.618, or more.
2.
A wide range bar (twice normal size) at point C is another indication
that the CD leg could become extended.
3.
Ideally, AB
=
CD moves are symmetrical in price and time. For exam-
ple, if the AB leg is six bars up, then the CD leg will be six bars up.
Consider this a failed example? Or stoploss not wide enough? Edit: I just found out that if the start of C leg is robust or very volatile, it's usually bad for the CD leg or it may extend longer CD LEG VARIATIONS These CD leg phenomena can be described in four ways: 1. If after point C has occurred a gap exists in the direction of point D, this usually indicates that the CD leg will be much greater than the AB leg1.272, 1.618, or more. 2. A wide range bar (twice normal size) at point C is another indication that the CD leg could become extended....
Ignored
A lot of different view points I'm sure.
1) Original bounce lower from AB=CD = 1.4032 was about 15 pips, so there would have been the opportunity to move SL to BE.
2) Very volatile pair. In hindsight a 30 SL would have covered it. That's not really that big of a SL considering a minimum move back to the X level was about 60 pips. Smaller position sizes needed for sure.
3) Big 2 candle D leg power move up automatically makes the candle symmetry very bad so a warning signal right from the start. Zooming out to the hourly and waiting for a TDI cross takes away the uncertainty of that whole volatile sweet zone.
4) Plenty of other opportunities. I think just the act of passing is a very good mental exercise in patience and is a building block to becoming a ninja type Wolfe wave stalker!
With due diligence we can always attempt to find a solution to our problem: Where do we enter the trade?
All in hindsight but this is how we can train ourselves to look at our problem from multiple angles (no pun intended)
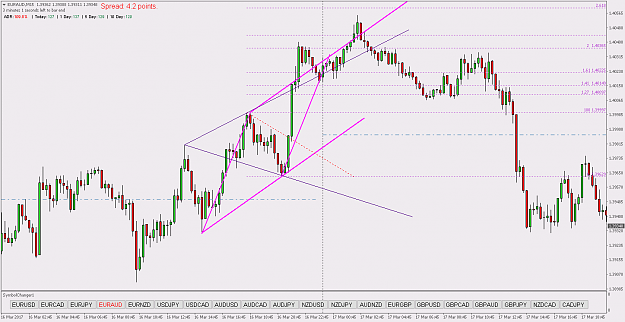
Zooming out to the hourly, I built the Gann angles using the Fib fan and look what it shows. The AB=CD completion level is still in "no mans" land. Price had broken north through the previous Gann angle, had a little re trace at the AB=CD level then continued north for one last surge EXACTLY to the next Gann angle before heading down 100 pips!!
EUR/AUD HOURLY GANN ANGLE ILLUSTRATION
Attached Image (click to enlarge)
Pride always comes before destruction.... -Proverbs 16:18
If using 30 pips as a stoploss, then this previous wolfe wave might as well ended up a breakeven also because price never reached there, not to mention the EPA. If i based my stoploss of this chart at the 2 fibo line there, it would be around 30 to 37pips depend on whether you entered on 1.27 or 1.41.
That is why i am currently starting to feel a little headache about position management. Should i use larger stops? Or lesser stops and quickly get out of the position?
Keep in mind that wolfe wave is basically an anti trend thing. We are selling at the highest point of a strong move up and vice versa. Most of my losses trades are being taken out quite fast. No hovering near my stops for a long time.
Would welcome any suggestions on position management.
{quote} Hi Parviz. Thanks for sharing this indicator. A couple of questions for you 1) Are you at liberty to share the code source as I would love to modify the line thickness and color, etc 2) Does the indicator only show the wave after completion? I'm wondering at what point the indicator decides the wave is complete? The reason I ask is because I draw all my waves free hand and tend to scale into my positions as price is heading towards the completion level. So I like to be prepared to execute before the wave actually completes. I know many others...
Ignored
Thanks a lot for testing and approving the indicator :you know i am not a professional programer and i do it just as a hobby
1.sure i will ,i'll send you the source if i may have your email .
2. yes it wait till the D wave is touching or above the trend line .As i learned many wait for entry till not only for breaking out of trend line but even for the wave to finish its retracement and retouch of trend line . so with this type of trading this indicator would tell you ahead of time when there is a good WW.
3. my suggestion is to use this indicator for a very fast scanning of different securities pairs and Time frames, then you may come back and reexamine each manually.
4 . the indicator works on zigzag indicator , so it wait till the D wave is formed (reversal happens) , then it will have the necessary 5 waves for proper analysis .
ps: By the way I believe I may change the code so that it can even shows the potential ww waves , if we do not have complete D wave ,then a potential CWW can only be predicted if XB and AC line are converging. Am i right ?, if this is all that is necessary then it can be applied.
{quote} Thanks a lot for testing and approving the indicator :you know i am not a professional programer and i do it just as a hobby 1.sure i will ,i'll send you the source if i may have your email . 2. yes it wait till the D wave is touching or above the trend line .As i learned many wait for entry till not only for breaking out of trend line but even for the wave to finish its retracement and retouch of trend line . so with this type of trading this indicator would tell you ahead of time when there is a good WW. 3. my suggestion is to use this...
Ignored
Yes, potential CWW must be converging.
Pride always comes before destruction.... -Proverbs 16:18
{quote} Well according to WW theory the actual wave would have been complete long before where the indicator shows point D. That's why I asked in my previous post how the indicator decides where the wave is complete because in this example the D point doesn't remotely line up with the sweet zone theory.
Ignored
hi expo :
there is another very important factor in detection of ww by this indicator , and that is the setting of ExtDepth input ,here i will show two picture of the same pair and time frame ,one with ExtDepth set to 6 and the other to 12 , as you noticed the 6 one detect earlier CWW:
Attached Image (click to enlarge)
Attached Image (click to enlarge)
OH by the way ,images are from the newest version that i am still working on it , it is supposed to detect other harmonics ,in addition to WW
Great thread you started here! I'm still trying to catch up with older posts, but I wanted to know if if your intent is to keep this discussion specific to forex instruments only?
Right now 100% of my focus is day trading the ES on a very short time frame. I mostly just trade the first two hours of the session primarily off a 1min chart. But I do keep an eye out on wolf waves and really like that pattern.
If I were to start all over again, I think I would have initially focused my energy on swing trading higher time frames first then working on intra-day trading which I think is much harder.
Anyways, wanted to say congrats and thanks for the effort you put into this thread. It's got me thinking of picking up a forex pair I could swing trade through futures at a different time of day so it wouldn't compete with my attention so much during ES open. Do you think USD/JPY would be good for that? I admittedly don't know much about forex I havent' spent much time trading it.
Also what is that stat that follows your post about being up 9.3% this month, I've never seen that on anyone else's posts, how does that work, are you running a fund or something?