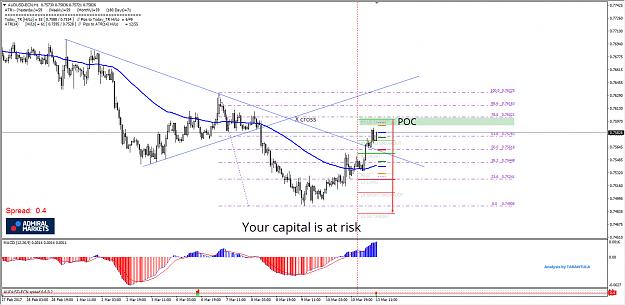
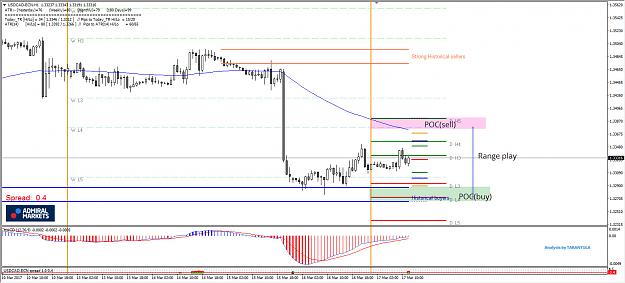
GBP/USD
4 hour https://fxmedia.s3.amazonaws.com/art...03-2017gu4.png
The GBP/USD is building a larger bullish retracement within a downtrend. The Fibonacci levels of wave 4 (blue) are potential resistance zones for a bearish turn.
1 hour https://fxmedia.s3.amazonaws.com/art...03-2017gu1.png
The GBP/USD could expand the correction within wave 4 (blue) via a WXY (orange) unless price breaks below the support (blue/green) which could trigger a continuation of the downtrend. The 38.2%-50% Fibonacci area is the most likely bouncing spot for a wave 4.
EUR/USD
4 hour https://fxmedia.s3.amazonaws.com/art...03-2017eu4.png
The Federal Reserve (Fed) will release its interest rate decision on Wednesday evening 6pm GMT. The major question is whether the FOMC (Federal Open Market Committee) will keep the rate at 0.75% or raise it to 1.0% which would typically lead to USD strength. The FOMC also offer its economic projections and statement. Price action could see increased volatility during and after the announcement (see Volatility Protection Settings at the bottom of this page).
The bearish price action of the EUR/USD after price reached the 61.8% Fibonacci retracement level of wave 2 (purple) could indicate that the wave 2 has been completed. A break below support (blue) could see price move lower to retest the bottom (green).
1 hour https://fxmedia.s3.amazonaws.com/art...03-2017eu1.png
The EUR/USD price action is showing lower lows and lower highs which could be part of a new downtrend. The current wave 4 (green) is invalid if price breaks above the 61.8% Fibonacci retracement level. A break below support could spark a bearish breakout within wave 3 (blue/purple).
EUR/USD
4 hour https://fxmedia.s3.amazonaws.com/art...03-2017eu4.png
Investors and traders were looking for a direction from the Federal Reserve (Fed) yesterday regarding the potential path of interest rate hikes during 2017. The Fed indicated that it expects 3 rate hikes during 2017, which seems to match expectations of the market.
Despite the interest rate increase from 0.75% to 1%, the US Dollar declined against other major currencies. The rate increase seemed to have already been priced. Another contributing factor was the lack of an even stronger hawkish tone (more rate hikes) in the meeting minutes from the Fed.
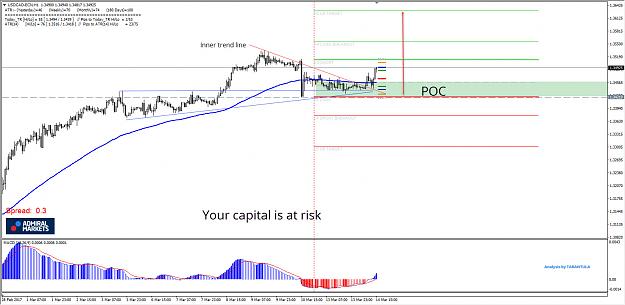
1 hour https://fxmedia.s3.amazonaws.com/art...03-2017eu1.png
The EUR/USD found support after the Fed news event, which has been labelled as a wave B (blue) in a larger ABC (blue) correction. The wave 2 (purple) is now approaching a key 78.6% Fibonacci resistance level. A break above the 100% level remains the invalidation point for the larger daily bearish trend.
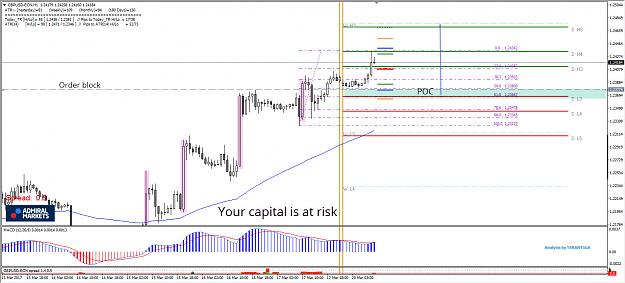
GBP/USD
4 hour https://fxmedia.s3.amazonaws.com/art...03-2017gu4.png
The GBP/USD bullish retracement is not showing any signs of exhaustion. A break above the resistance trend line (red), which is the bottom of wave 1 (blue), would invalidate the wave 4 (blue). In that case, price is probably building an ABC rather than a 123 (green).
1 hour https://fxmedia.s3.amazonaws.com/art...03-2017gu1.png
The GBP/USD has reached a critical decision zone where the breakout above resistance (red) or below support (blue/green) would indicate an uptrend or downtrend.
Dear Traders,
Price action is always popular with traders and rightfully so. But I always recommend traders to keep in mind the importance of time, too.
This article explains the impact of time on analysis and trading decisions. It also reviews how to be properly prepared for the trading day and week. http://admiralfiles.s3.amazonaws.com...0px-violet.png
Does only price count, or time too?
Price action traders would probably say no without perhaps realising that charts are in fact a combination of both price and time. The right side (vertical axis) shows price and the bottom (horizontal) shows time.
So, going back to the question of does time count, my answer is yes, time is important in various ways such as my time factor pattern and fractal.
But time also impacts the market in other ways, such as
GBP/USD
4 hour https://fxmedia.s3.amazonaws.com/art...03-2017gu4.png
The GBP/USD turned at the 50% Fibonacci level of wave E (green) but a larger bullish correction via a WXY (blue) seems likely at this point. The Fibonacci levels of wave X (blue) could therefore be bouncing spots.
1 hour https://fxmedia.s3.amazonaws.com/art...03-2017gu1.png
The GBP/USD seems to have completed a 5th wave (purple) and is now building a bearish correction via an ABC (orange) zigzag.
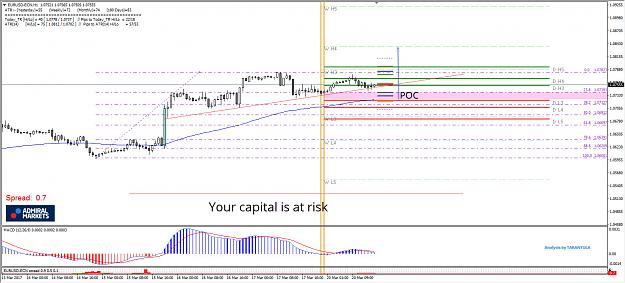
EUR/USD
4 hour https://fxmedia.s3.amazonaws.com/art...03-2017eu4.png
The US Dollar is struggling to show any signs of strength as the EUR/USD keeps pushing higher and higher in a bullish trend channel (red/blue lines). A push above the horizontal resistance (orange) invalidates the wave 2 (purple), which seems likely at the moment when considering deep bullish retracement.
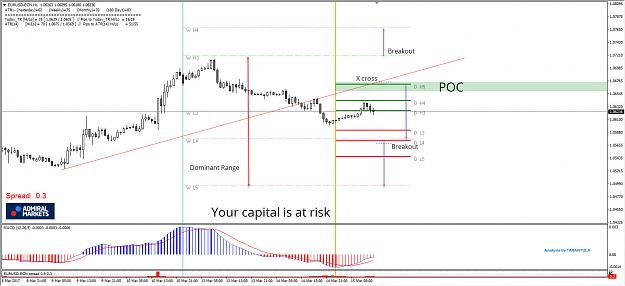
1 hour https://fxmedia.s3.amazonaws.com/art...03-2017eu1.png
The EUR/USD broke the resistance trend line (dotted red) of the contracting. A break above the resistance could see price move higher within a wave 5 (purple) towards the Fibonacci targets of wave 5 vs 1+3.
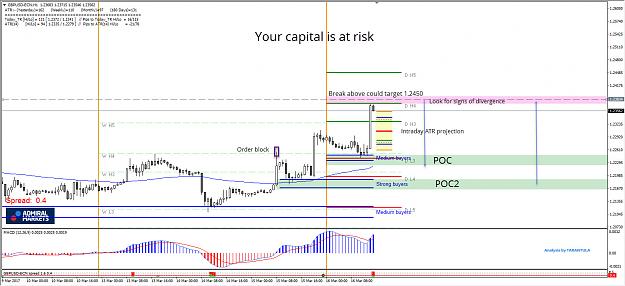
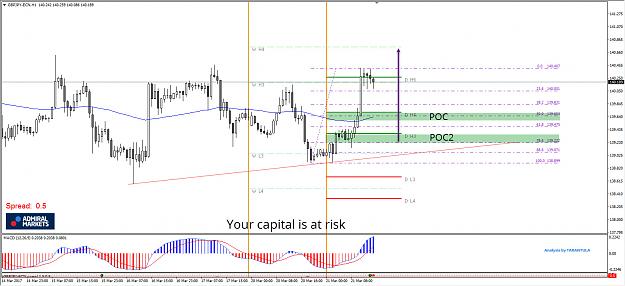
GBP/USD
4 hour https://fxmedia.s3.amazonaws.com/art...03-2017gu4.png
The GBP/USD is in an uptrend channel indicated by the support (green) and resistance (red) trend lines. Price seems to be breaking above the 61.8% Fibonacci level which means that price could test the next Fib at 78.6%.
1 hour https://fxmedia.s3.amazonaws.com/art...03-2017gu1.png
The GBP/USD is trying to build a bullish breakout above resistance (dotted red).