I am going to share a trading method that has been brought to my attention by a fellow trader
friend of mine. This is not his only method, but he uses it with an average amount of success.
He keeps his losers too am bare minimum & lets the winners run. Months ago I shared with him
the contents of The Similarity Thread & this is the results of some of the contents of that thread.
I too have the setup running of the EURUSD, but have only traded the signals in demo as I trade
a totally different way using NO indicators. NO I want share or describe how I am trading, so
don't ask. If I shared it the results would be like the Turtle Traders.......many would never get it.
What works for one will NOT always work for the next one.
I am only sharing this method because I have picked up many bits & pieces from this forum over the
years & thought I would offer up this method to anyone that may be looking for a method they can
refine, or retool to suite them & their mindset. Lets be clear UP FRONT.....I am NOT going to help
you along the way. I am not coach, or trainer. I DO NOT HAVE THE TIME. I have only looked at this
method in DEMO MODE on the 15M time frame. I make NO guarantee that this method will work
for you, or anyone. From the time I have spent & from what my trader friend tells me.....you
will need to known how to use the Bollinger Band indicator before you dive into this method. Learn
that & the rest is very evident from looking at the chart. I have long ago abandoned the traditional
indicators as I could never make them work for me, but I am not saying they don't have their place
in the trading arena. I have just discovered a better way that works better for me & my mindset.
It took many years for me to make this discovery with much help along the way.
One final bit of info before laying out the method. Yes I started this thread, but I will not answer the many
questions that go along with starting a thread. I really hope someone with the time & skills will take this
& see if will work for them & go with it. I want to say this is NOT a method for new traders, but I could be wrong.
Again, I am NO TRAINER, or COACH so don't ask. Not trying to be smart, but you will be much better off
with someone else helping you. There are many among the members of this forum much more skilled than
me to help you. Below you will find what you need to get start taking a look at this method.
Time Frame - 15M or 30M. Currency Pairs - EUR/USD, GBP/JPY, GBP/USD & other of your choice.
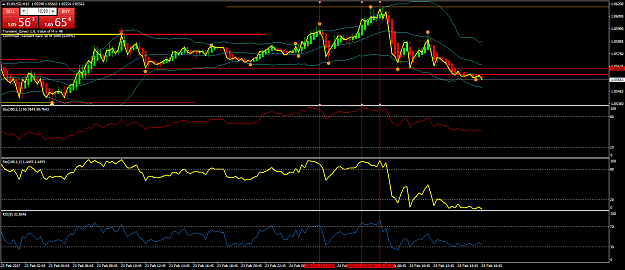
The tools - 1. Bollinger Bands set @ 24, 0, 2 @ Close. 2. Stochastic Set @ 300, 1, 1 @ Close MA @ EMA.
3. Stochastic Set @ 100, 1, 1 @ Close MA @ EMA. 4. EMA 1 Set @ Close. 5. RSI @ 8 @ Close.
Now a few tips to get started........Learn how to use Bollinger Bands......Pay attention to the EMA 1 when it
crosses outside of the Bollinger Bands.....when you see this take note of the 2 Stochastic & RSI......If all
Stochastic & RSI indicators are giving you a sell signal & the EMA 1 is outside of the Bollinger Band & Price
has cleared the outside (TOP) of the Bollinger Band then you just might have a sell signal. There are
times that the Stochastic 300 will not be in harmony with the other indicators, but the signal will still be
correct. When Stochastic 300 is in agreement the signal is stronger. Reverse this for BUY signals.
You know that I'm sure.
If you DO NOT understand the workings of Bollinger Band.......get a firm grip on it before you start. I DO
NOT trade this method. so I do not know how well it works over time. Load up the indicators & see for
yourself. If you are a fan of back testing run it on a simulator & see what the results are. Forward test it in
a DEMO. Use it at your own risk. I am just putting this out there for anyone to give it a try.
I want to say thank you to the traders on this thread that shared their hard earned knowledge with those that
are trying to learn this business. There are four traders on this forum that have shared their wisdom & if
you have been blessed enough to find those traders & study what they have posted you should be well on
your way to making a go of this business. I will call NO NAMES, but THEY know who you are.
Well its time to stop this rant & let this get posted. I will PROBABLY NOT post another method on this forum..
or any other forum as I do not have the time, but for what it is worth (probably not much, but maybe it is)try it
it & see what you can make of it.
An old trader friend now deceased told me one time "Trade What You See & Don't Worry About The Rest".
Good Trades To All.
__________________________
friend of mine. This is not his only method, but he uses it with an average amount of success.
He keeps his losers too am bare minimum & lets the winners run. Months ago I shared with him
the contents of The Similarity Thread & this is the results of some of the contents of that thread.
I too have the setup running of the EURUSD, but have only traded the signals in demo as I trade
a totally different way using NO indicators. NO I want share or describe how I am trading, so
don't ask. If I shared it the results would be like the Turtle Traders.......many would never get it.
What works for one will NOT always work for the next one.
I am only sharing this method because I have picked up many bits & pieces from this forum over the
years & thought I would offer up this method to anyone that may be looking for a method they can
refine, or retool to suite them & their mindset. Lets be clear UP FRONT.....I am NOT going to help
you along the way. I am not coach, or trainer. I DO NOT HAVE THE TIME. I have only looked at this
method in DEMO MODE on the 15M time frame. I make NO guarantee that this method will work
for you, or anyone. From the time I have spent & from what my trader friend tells me.....you
will need to known how to use the Bollinger Band indicator before you dive into this method. Learn
that & the rest is very evident from looking at the chart. I have long ago abandoned the traditional
indicators as I could never make them work for me, but I am not saying they don't have their place
in the trading arena. I have just discovered a better way that works better for me & my mindset.
It took many years for me to make this discovery with much help along the way.
One final bit of info before laying out the method. Yes I started this thread, but I will not answer the many
questions that go along with starting a thread. I really hope someone with the time & skills will take this
& see if will work for them & go with it. I want to say this is NOT a method for new traders, but I could be wrong.
Again, I am NO TRAINER, or COACH so don't ask. Not trying to be smart, but you will be much better off
with someone else helping you. There are many among the members of this forum much more skilled than
me to help you. Below you will find what you need to get start taking a look at this method.
Time Frame - 15M or 30M. Currency Pairs - EUR/USD, GBP/JPY, GBP/USD & other of your choice.
The tools - 1. Bollinger Bands set @ 24, 0, 2 @ Close. 2. Stochastic Set @ 300, 1, 1 @ Close MA @ EMA.
3. Stochastic Set @ 100, 1, 1 @ Close MA @ EMA. 4. EMA 1 Set @ Close. 5. RSI @ 8 @ Close.
Now a few tips to get started........Learn how to use Bollinger Bands......Pay attention to the EMA 1 when it
crosses outside of the Bollinger Bands.....when you see this take note of the 2 Stochastic & RSI......If all
Stochastic & RSI indicators are giving you a sell signal & the EMA 1 is outside of the Bollinger Band & Price
has cleared the outside (TOP) of the Bollinger Band then you just might have a sell signal. There are
times that the Stochastic 300 will not be in harmony with the other indicators, but the signal will still be
correct. When Stochastic 300 is in agreement the signal is stronger. Reverse this for BUY signals.
You know that I'm sure.
If you DO NOT understand the workings of Bollinger Band.......get a firm grip on it before you start. I DO
NOT trade this method. so I do not know how well it works over time. Load up the indicators & see for
yourself. If you are a fan of back testing run it on a simulator & see what the results are. Forward test it in
a DEMO. Use it at your own risk. I am just putting this out there for anyone to give it a try.
I want to say thank you to the traders on this thread that shared their hard earned knowledge with those that
are trying to learn this business. There are four traders on this forum that have shared their wisdom & if
you have been blessed enough to find those traders & study what they have posted you should be well on
your way to making a go of this business. I will call NO NAMES, but THEY know who you are.
Well its time to stop this rant & let this get posted. I will PROBABLY NOT post another method on this forum..
or any other forum as I do not have the time, but for what it is worth (probably not much, but maybe it is)try it
it & see what you can make of it.
An old trader friend now deceased told me one time "Trade What You See & Don't Worry About The Rest".
Good Trades To All.
__________________________