May i please ask a question?
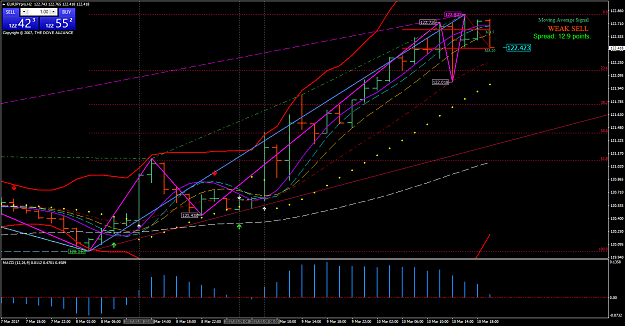
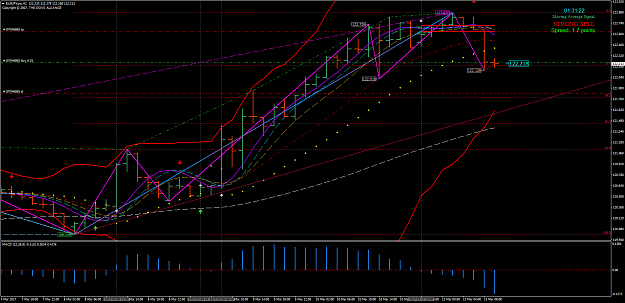
In regards to Friday's trading session...when the SAR detached from DB onto EMA it was mid way of a H2 candle. At the H2 hit on EMA was also the hit on H1 PSAR.
In this scenario is it more confluent to trade the H1 or wait the close of the H2?
My "fear" in this is that because of my "perceived inexperience" i may inadvertently enter at the top and waste my time ... if i had of actually been online at the time of the H2 chart indicating a Long...would i have taken it? & on the H1 close or on the H2 close?
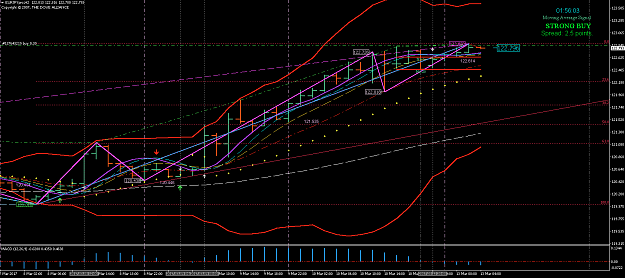
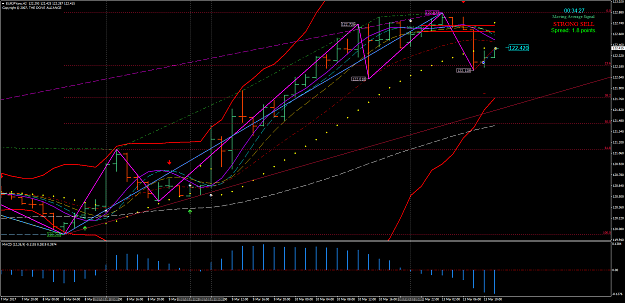
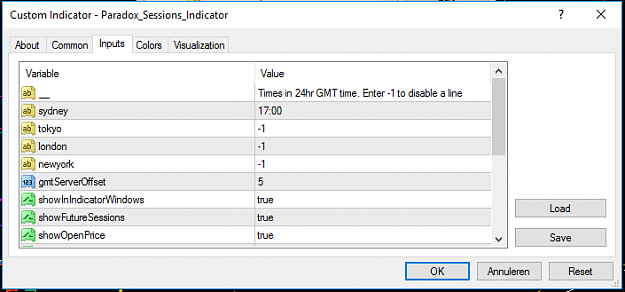
Attached Image (click to enlarge)
If you make up your own rules then the story is sad.....