{quote} Hello leeta thank you for sharing the trade idea. If i may, a comment or two the black line is not an accuracte depiction of momentum because there were no 2 pivot lows to comment in there secondly, the red momentum line, try to ensure you are joining the two most recent peaks closet to current price. You seem to have started the line from too far back best wishes
Hello Akt, Nice to meet you too. Regarding the lack of profit margin, is it due to break of down momentum in H1 and created a demand zone marked in Orange. Thanks {image} {quote}
Ignored
Hi shyean
It is more because of the DZ being too close, yes
best wishes
Be careful what you think because your thoughts run your life..Solomon
In my last post I took a rushed trade in Gold, without doing the multitimeframe analysis, which is valuable. So I have to correct my mistake.
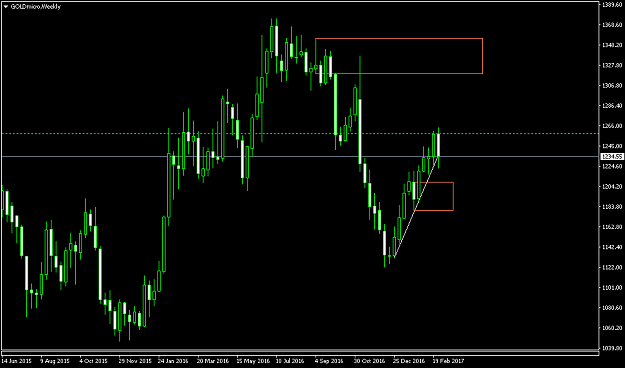
Curve timeframe (weekly / orange color): The trend is up. The upside trendline is about to be broken. We can see the horizontal line which is at the middle point between the proximal lines of the weekly SZ and DZ. The price reached that line and reversed.
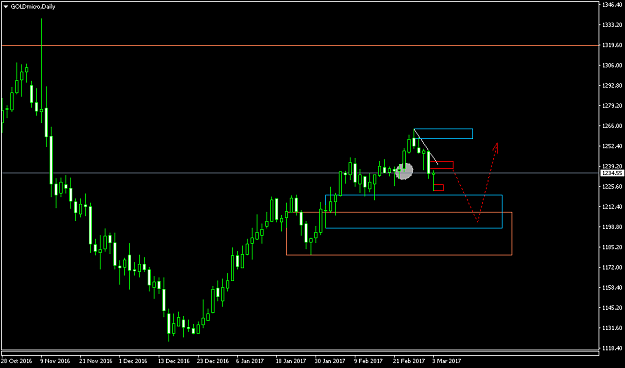
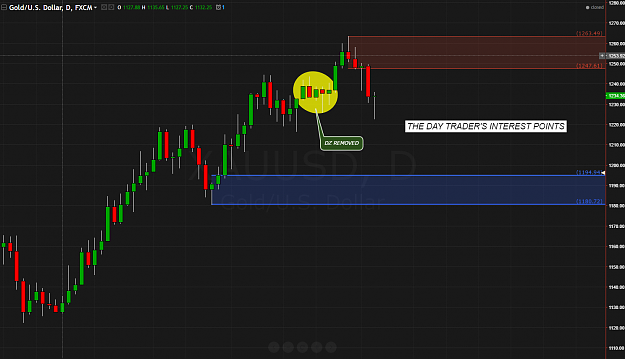
Trend timeframe (daily / blue color): On the daily chart we can see that the trend is down (a DZ removed + the ability to draw a momentum trendline).
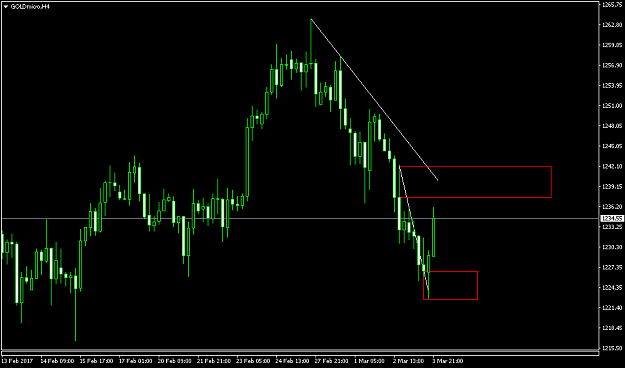
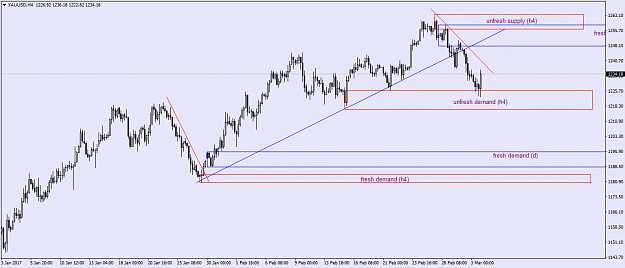
Execution timeframe (4H / red color): Downtrend, but the trendline has been broken and a fresh demand zone has formatted.
Conclusion : We are in a retracement of the weekly uptrend. The daily downtrend can be stopped only by the weekly buyers.On the daily chart we can see the possible senario. The price will reach the 4H SZ .. and then the weekly demand zone .. and then will rally upwards.
Gold A pullback In my last post I took a rushed trade in Gold, without doing the multitimeframe analysis, which is valuable. So I have to correct my mistake. Curve timeframe (weekly / orange color) : The trend is up. The upside trendline is about to be broken. We can see the horizontal line which is at the middle point between the proximal lines of the weekly SZ and DZ. The price reached that line and reversed. Trend timeframe (daily / blue color) : On the daily chart we can see that the trend is down (a DZ removed + the ability to draw a momentum...
Ignored
"The markets can remain irrational longer than you can remain solv
Gold A pullback In my last post I took a rushed trade in Gold, without doing the multitimeframe analysis, which is valuable. So I have to correct my mistake. Curve timeframe (weekly / orange color) : The trend is up. The upside trendline is about to be broken. We can see the horizontal line which is at the middle point between the proximal lines of the weekly SZ and DZ. The price reached that line and reversed. Trend timeframe (daily / blue color) : On the daily chart we can see that the trend is down (a DZ removed + the ability to draw a momentum...
Ignored
Hello Elios
Thank you for sharing you thoughts on the shiny metal
If i may, a note on the daily chart, it is sideways because one demand zone has been removed. It is not yet possible to identify downside momentum because price is yet to form 2 pivot highs
best wishes
Be careful what you think because your thoughts run your life..Solomon
{quote} Hello Elios Thank you for sharing you thoughts on the shiny metal If i may, a note on the daily chart, it is sideways because one demand zone has been removed. It is not yet possible to identify downside momentum because price is yet to form 2 pivot highs best wishes
Hello Elios, Allow my participation, for Akt and fellow traders comments too. Thanks Gold Weekly: {image} Daily: {image} H4: {image} {quote}
Ignored
Thanks for your participation, shyean.
My comment is that we make an analysis for the next week, so we choose to draw the zones that the price is possible to reach the next week. The rest zones have no interest.
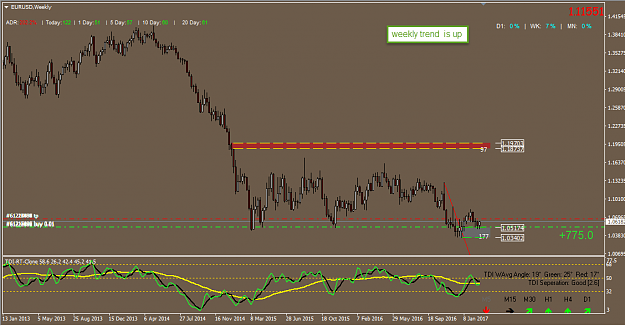
hello T.I.O.F traders and AKT. I want thank AKT for showing us his method. To be honest, this method has now given me a new set of eye balls and trading is starting to make sense.
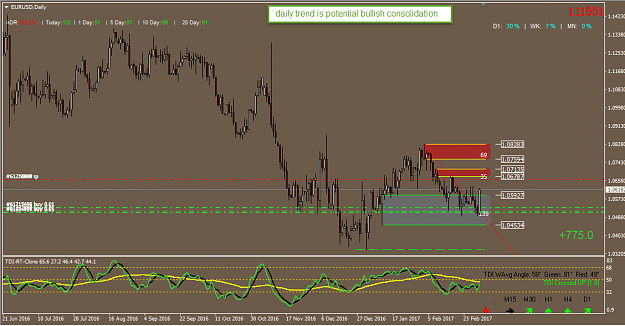
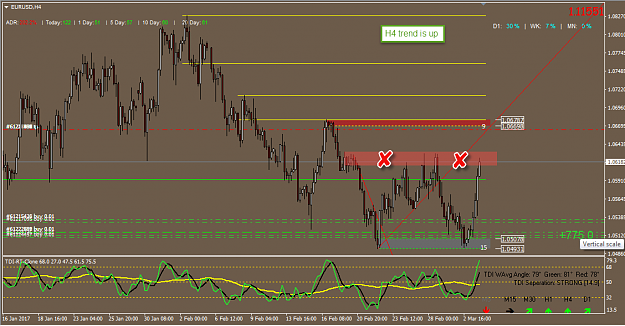
EURUSD:
weekly
Hi all, hope all is well akt.
Looking for the teams thought and advice for the few of us like me that trade on the smaller Tf intraday basis only. Any type of tips or lessons learned are welcomed.
Mine would be that to never marry a trade. Meaning it might look good now i.e. price doing what we expected and profits increasing. but always keep your gaurd up stick to the rules. The market can throw anything at us particularly on the smaller Tf. Don't chase the trade if for example the stop loss has been hit know that it was a pre defined level and risk was accepted. If price is not doing what you want don't chase it most the time you've been hinted by the market and it's simply not worth chasing. Stick to the rules you will live to fight another day
hello T.I.O.F traders and AKT. I want thank AKT for showing us his method. To be honest, this method has now given me a new set of eye balls and trading is starting to make sense. EURUSD: weekly 2214352 Daily 2214354 H4: 2214362 best wishes
Ignored
Would you please use the Attach files / Upload from Device feature to attach your images to your Reply ?
I cannot access your attachments.
Or is it just me
{quote} Would you please use the Attach files / Upload from Device feature to attach your images to your Reply ? I cannot access your attachments. Or is it just me
Ignored
hello foxtrader16. I have edited the post. Thanks for pointing it out.
Mine would be that to never marry a trade. Meaning it might look good now i.e. price doing what we expected and profits increasing. but always keep your gaurd up stick to the rules. The market can throw anything at us particularly on the smaller Tf. Don't chase the trade if for example the stop loss has been hit know that it was a pre defined level and risk was accepted. If price is not doing what you want don't chase it most the time you've been hinted by the market and it's simply not worth chasing. Stick to the rules you will live to fight another...
Ignored
Very wise conclusions. With SAD method you dont have to chase the price. Most of the time I put limit orders and I am waiting for the price to come to me. When I am stopped out... that means something. Either I am wrong with the trend or I am right with the direction and the price maybe stop at a nearby zone. This is a crucial decision.If I am wrong with the trend and I re-enter in the wrong direction.... this is a mistake ... and means that I am chasing the price.
"When the momentum on one chart is lost, we cease to trade in the direction of the preceding trend on that chart and seek to trade at zones found on one time frame higher"
I'm thinking the Daily down momentum lost, so the short would have to be at Weekly supply zone (Orange box)?
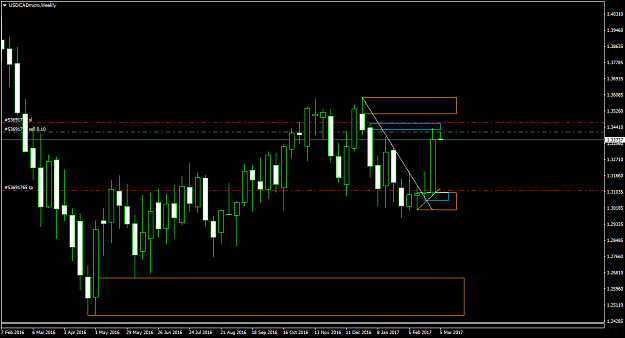
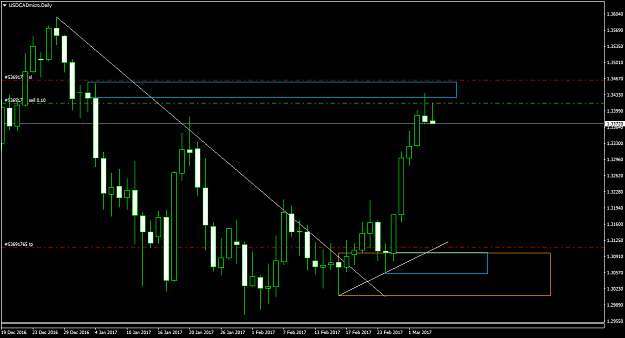
Good morning everyone. USD/CAD Trend timeframe (weekly / orange color) ) : Bearish sideways trend. The momentum trendline has been broken and a fresh demand zone has formatted. Execution timeframe (daily / blue color): Up trend {image} {image}
Ignored
"The markets can remain irrational longer than you can remain solv
Hello Elios, With reference to post #318, "When the momentum on one chart is lost, we cease to trade in the direction of the preceding trend on that chart and seek to trade at zones found on one time frame higher" I'm thinking the Daily down momentum lost, so the short would have to be at Weekly supply zone (Orange box)? Thanks {quote}
Ignored
I think your opinion is logical and you are right. Fortunately there is a weekly supply zone inside the daily SZ. We will see if this is the right zone or the higher one.