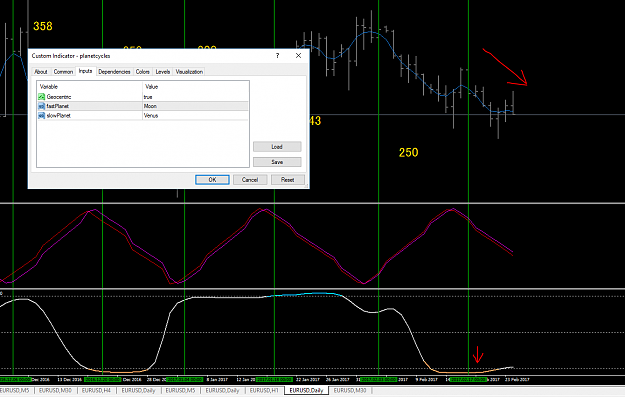
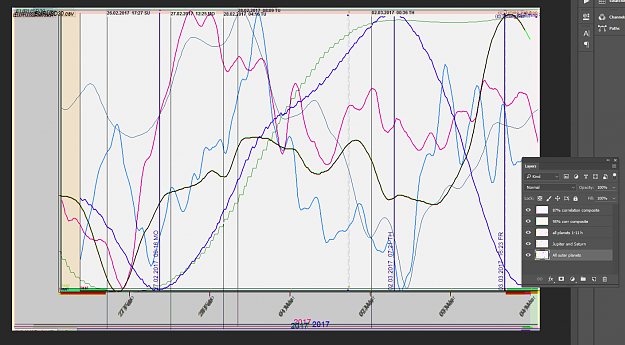
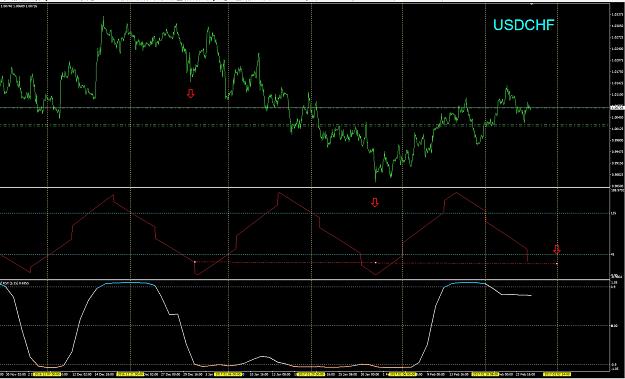
Here is that model, (Jupiter and Saturn high harmonics, phase) for next week... buy and sell points marked.
What is planetary phase? https://en.wikipedia.org/wiki/Planetary_phase
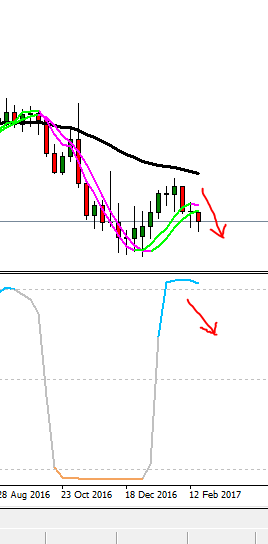
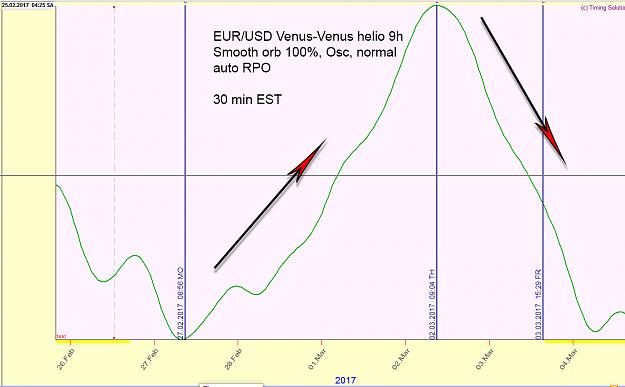
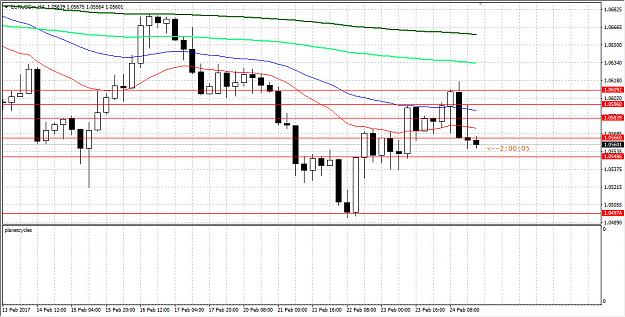
Just as a reminder, the peaks and valleys of these sine waves DO NOT indicate price levels! They only point to points in time we can expect a trend change. The next small chart is showing the Weekly price action and it is showing the trend is down for the moment. We have another week to allow the planetary cycles indicator on the post just below (Moon and Venus) to reach its conclusion.
Trend changes can also be down to sideways or up to sideways... as well as down to up, up to down... and finally sideways to up, and sideways to down.
The second chart is a Weekly view of EUR/USD in MT4.
What is planetary phase? https://en.wikipedia.org/wiki/Planetary_phase
Just as a reminder, the peaks and valleys of these sine waves DO NOT indicate price levels! They only point to points in time we can expect a trend change. The next small chart is showing the Weekly price action and it is showing the trend is down for the moment. We have another week to allow the planetary cycles indicator on the post just below (Moon and Venus) to reach its conclusion.
Trend changes can also be down to sideways or up to sideways... as well as down to up, up to down... and finally sideways to up, and sideways to down.
The second chart is a Weekly view of EUR/USD in MT4.
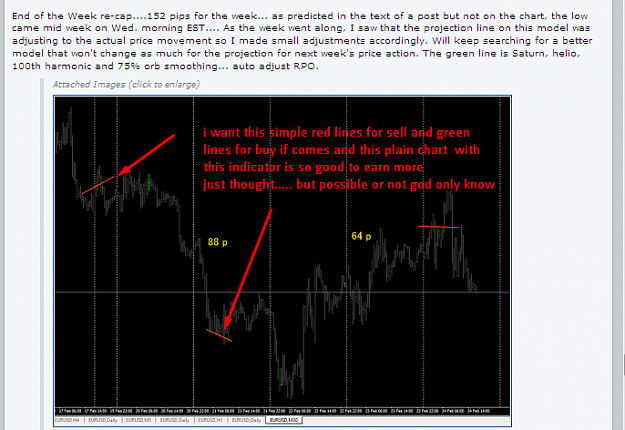
Attached Image (click to enlarge)
Attached Image