{quote} Jerry, there are 6 green vertical lines on this chart . Would you please tell us what exactly Moon-Venus aspects they represent ? Thanks for these interesting posts
Ignored
I manually placed them 3 bars after the turn in the indicator then used the RSX indicator to help with the decision to go long or short...
" When vertical line is placed 3 bars after Moon-Venus turn if the RSX is high, go short, if low, go long."
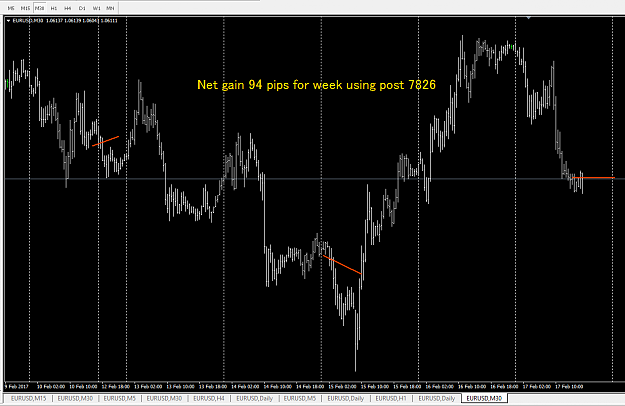
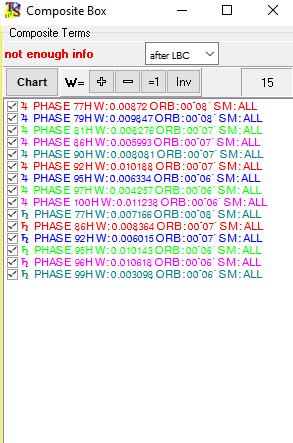
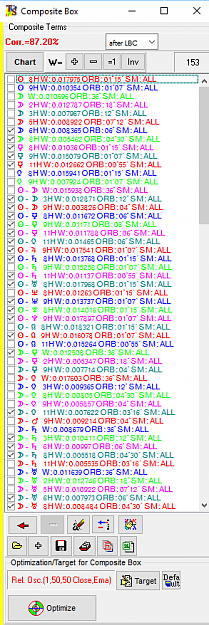
Here is a new way to create a projection line for next week. I ran the auto selection option in the Astronomy module and it examined more than 1,000 combinations of planetary aspects then the program gave me a list of the most promising ones. I ran 1st through 10th harmonic, Geocentric and Heliocentric, Moon through Pluto including North node.... next i manually turned on and off each of the 153 best aspects leaving 77 now all blended together until I found the highest correlation, now at 87.2%. One big benefit of this approach is that as I set the LBC back in time, (last bar the program sees) the projection line doesn't move.
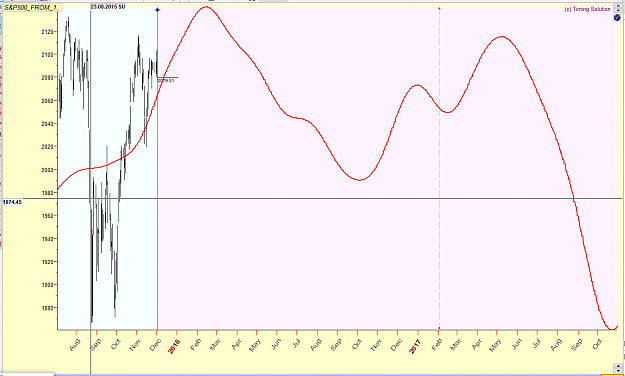
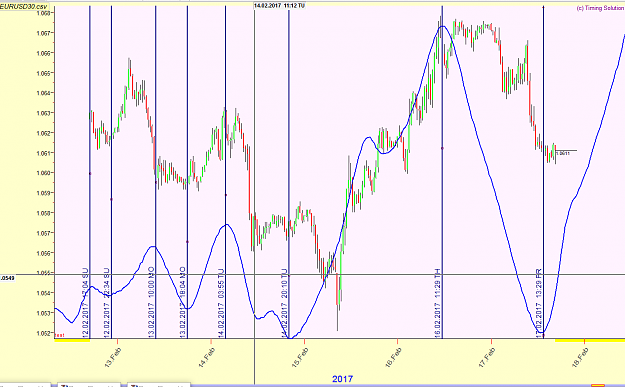
The third chart shows how the curve would have worked for last week as the LBC was set to the last bar of the trading week on Feb 10th, the week before.
{quote} jnevins, I think it's somewhere on FF, anyway please find enclosed indicator, currently setup is 2 indicators in same window, first one Moon/Saturn, second Moon/Jupiter. That will be great if we can somehow backtest it with historical data. Btw. I can see you're expert with TS, did you try Quantum Figures, if so I would like to hear your thoughts about it. {file}
Ignored
i cant seem to attach the planatary cycle indicator to my MT4 chart. Can someone help me out.
THanks
{quote} i cant seem to attach the planatary cycle indicator to my MT4 chart. Can someone help me out. THanks
Ignored
Styngray, maybe you guys missing swedll32.dll in "library" folder. Anyways, please find attached .dll. Also, you can check if you get any error msg. in journal tab when you add indicator on chart.
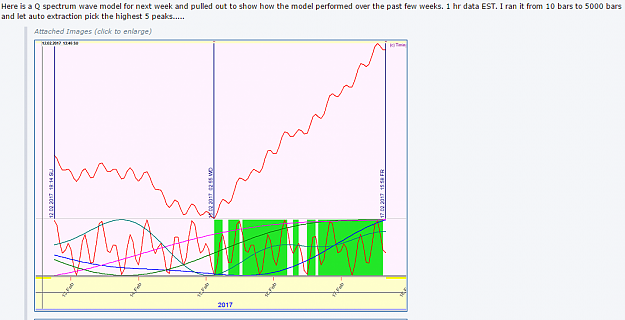
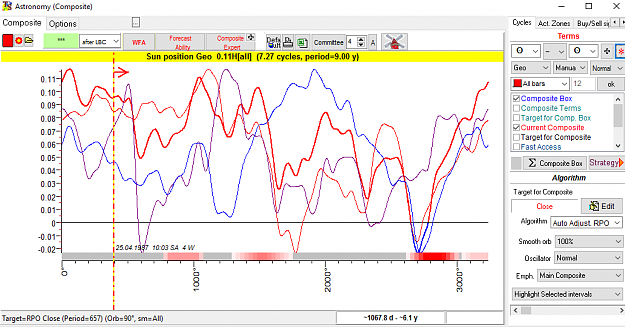
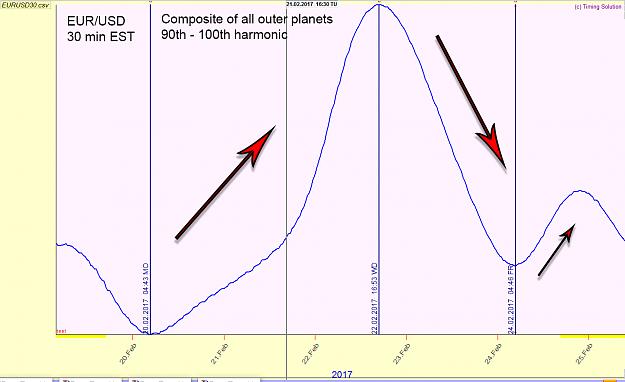
Here is a more simple view of next week using a composite of all outer planets using the 90th to 100th harmonic. Monday is a bank holiday in the US so expect a slower NY session.... it largely agrees with the projection above.....
{quote} Styngray, maybe you guys missing swedll32.dll in "library" folder. Anyways, please find attached .dll. Also, you can check if you get any error msg. in journal tab when you add indicator on chart. {file}
Ignored
If you have a 64 bit machine place try placing it in the system 64bit folder instead of system32, I think it's called sysWow64 or something like that...also there is a 64bit dll file floating around somewhere on the net. I had the same problem but one of the both mentioned solved it. Also don't forget the eph include file.
Here is a new way to create a projection line for next week. I ran the auto selection option in the Astronomy module and it examined more than 1,000 combinations of planetary aspects then the program gave me a list of the most promising ones. I ran 1st through 10th harmonic, Geocentric and Heliocentric, Moon through Pluto including North node.... next i manually turned on and off each of the 153 best aspects leaving 77 now all blended together until I found the highest correlation, now at 87.2%. One big benefit of this approach is that as I set...
Ignored
How many hours or minutes does it take to run a test such as that on that software. The posts are great, btw.
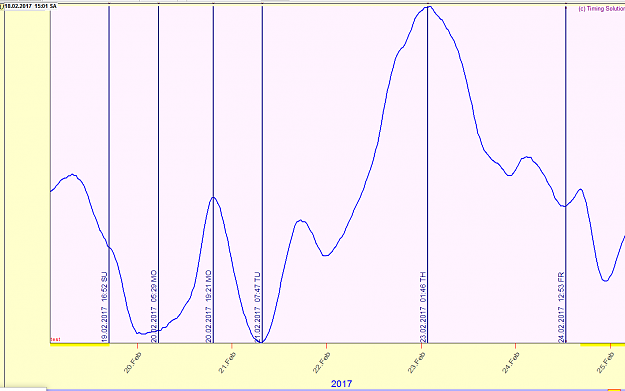
Here is a more simple view of next week using a composite of all outer planets using the 90th to 100th harmonic. Monday is a bank holiday in the US so expect a slower NY session.... it largely agrees with the projection above..... {image}
Ignored
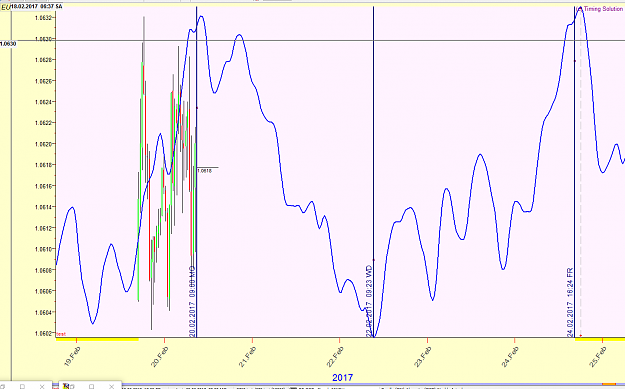
Interesting projection. Long now till late Wednesday then short till early Friday. Will be interesting to observe.
{quote} Interesting projection. Long now till late Wednesday then short till early Friday. Will be interesting to observe.
Ignored
I hope that is your demo account and only .01 lots!
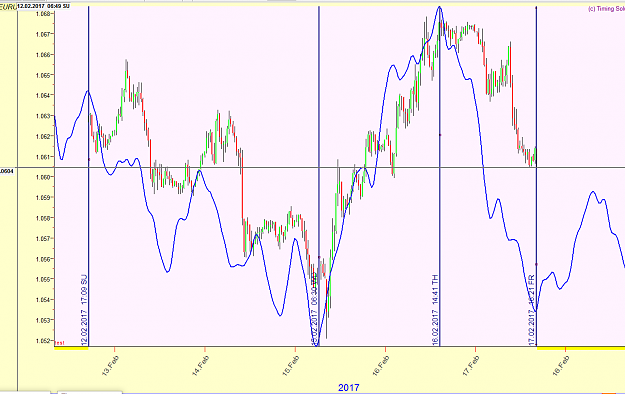
Just to throw a monkey wrench into the mix I ran just Jupiter and Saturn, planetary phase, 75 - 100 harmonics and found this line which presents an alternative view... short until Wednesday morning (like last week) then long until the close on Friday.... Planetary phase is usually thought of in terms of the planets inside of Earth's orbit like Venus and Mercury and one can observe the light on them changing as we do as the moon as it goes through its phases... (so this may be a fictitious model) Here is a link to a good explanation Sergey provides and how it can work with the outer planets as well... http://www.timingsolution.com/TS/Study/Phase/index.htm
The computer ran for at least 45 minutes (hexcore, 3.2 ghz CPU, 16 gb RAM) to calculate the projection line in post 7883, then another 45 minutes to optimize both automatically then manually...
The 2nd chart is how this model performed last week....
3rd image is a view of the 15 elements that went into this model...
Jerry, can you transfer my request in post #7874 to the TS group ? Perhaps anybody there is interested in also. Sixer
Ignored
I am happy to do that... can you post or send me the link to the image, that way I can see what Jupiter cycle was used. Was it helio, geo, what harmonic, etc?
hi Jnevis,
I find very interesting your projection. I have read the posts, I have download differents indicators, but doesn't functions. Could you please sharing the last version that you are using ?
Thanks
{quote} I hope that is your demo account and only .01 lots! Just to throw a monkey wrench into the mix I ran just Jupiter and Saturn, planetary phase, 75 - 100 harmonics and found this line which presents an alternative view... short until Wednesday morning (like last week) then long until the close on Friday.... Planetary phase is usually thought of in terms of the planets inside of Earth's orbit like Venus and Mercury and one can observe the light on them changing as we do as the moon as it goes through its phases... (so this may be...
Ignored
It was interesting, but for me not tradeable without knowing more. However, the trade could still be valid since it's still within a stop loss buffer zone.
When you say 75 - 100 harmonics are you talking about angle of planet to earth or to each other, or something else entirely?
{quote} It was interesting, but for me not tradeable without knowing more. However, the trade could still be valid since it's still within a stop loss buffer zone. When you say 75 - 100 harmonics are you talking about angle of planet to earth or to each other, or something else entirely?
Ignored
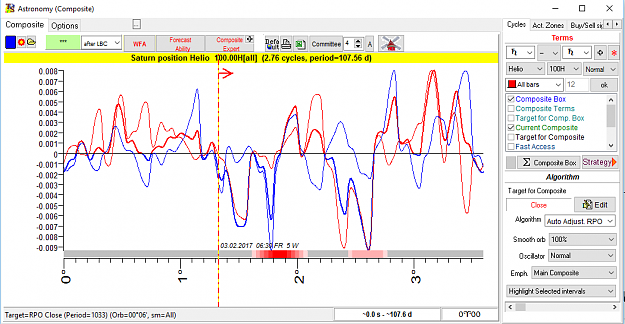
In Timing Solution, when the cycle is too long to be of any use, the "harmonic" is a way to divide the cycle length by that number... so in the case of the Saturn Helio cycle, if I use the 100th harmonic, it divides it's one period of 27.9 years by 100 = 107.5 days. With the 10,000 bars of 30 minute history that I use, it gives 2.76 cycles to examine.
hi Jnevis, I find very interesting your projection. I have read the posts, I have download differents indicators, but doesn't functions. Could you please sharing the last version that you are using ? Thanks
Ignored
Hello Beldame,
You need to install the swiss ephemeris .dll in the include folder in MT4 and enable .dll's in the options. The swiss ephemeris supplies the information the indicator uses to draw the projection line. Look back a few posts and find the .zip folder to download.
It is the 4th chart at the TS website under "Software". Sixer
Ignored
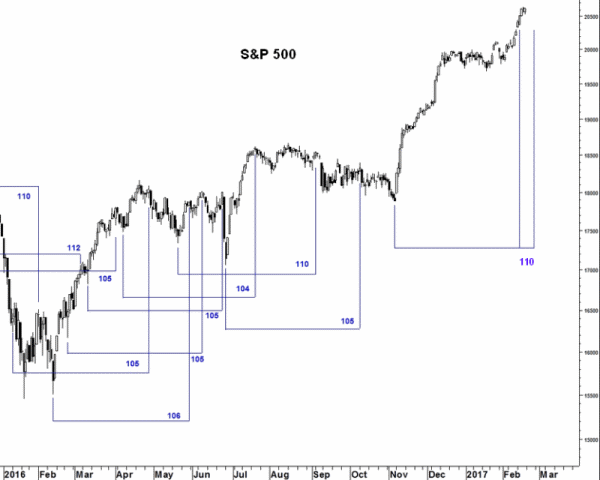
Okay got it... it is a 9 year cycle, Sergey has created it by using Sun position Geo and and setting the harmonic to .11 manually. My S and P 500 data only extended to Dec. 2, 2015... I tried downloading more recent data with my FXCM Historical Downloader but only forex pairs were available. The 3rd chart shows the data series I have, daily, of 16,394 bars going back to March 3, 1950. I placed the buy and sell signals as well as the equity line...
"The Juglar cycle is a fixed investment cycle of 7 to 11 years identified in 1862 by Clment Juglar.[1] Within the Juglar cycle one can observe oscillations of investments into fixed capital and not just changes in the level of employment of the fixed capital (and respective changes in inventories), as is observed with respect to Kitchin cycles. 2010 research employing spectral analysis confirmed the presence of Juglar cycles in world GDP dynamics.[2]"
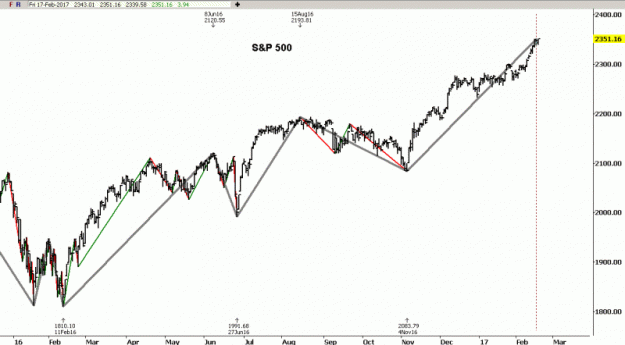
Here is the last year missed in your S&P 500-chart for comparison.
Thanks for the other infos too.
Sixer
Edit1: a 2nd chart
George Lindsay wrote of a 107-day interval which he used as a confirming tool for finding highs in the Dow.
Like all of Lindsay's models, this one was not to be used in isolation -
a common mistake made by those familiar with his most popular model - Three Peaks and a Domed House.
Edit2:
The 7-years cycles was working for some years, but now it failes ....