Hi all, I'm gonna dump some astro-related mt4 indicators (using the astro-swiss library) here by the end of the week.
Ignored
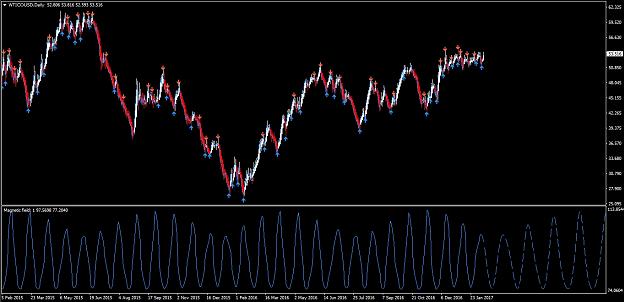
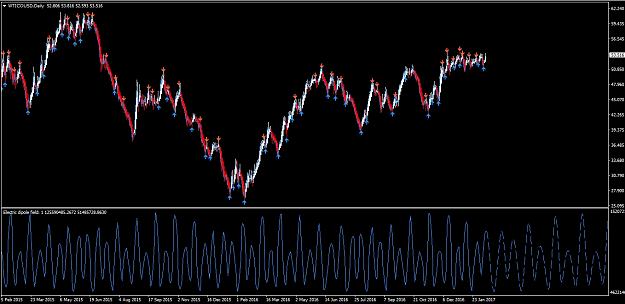
The indicators calculating electric and magnetic fields of the heavenly bodies (default:Moon) onto the center of the Earth assuming they are electric dipoles induced by the Sun (and hence orientated along the Sun-body line).
I miss the indicator shared from bongo bongoo more than one year ago - see posts #6589 + #6591. If i remember correctly, you must click at the last low/high to get it working. Sixer {image} {file}
{quote} There is an eSignal HURST Cycle Indicator that has the full source disclosed {image}
Ignored
The indicator from this post still works.
The source code of an indicator with the same functionality can be found in the first post here.
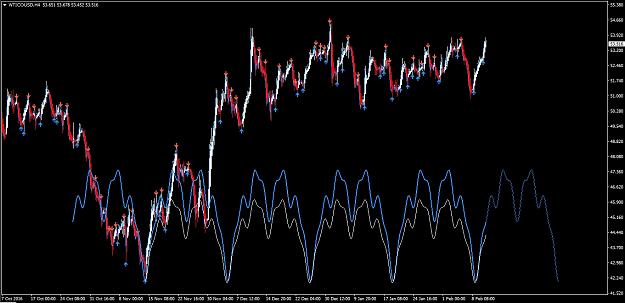
Both calculations are the same - imho not in the spirit of Hurst's work - and the remark here holds. The bongo bongoo's indicator is shown in blue, and the one from the linked source code is white in the chart below.
Thanks for the comparison - can you show the Cycle indicator for the EURUSD chart too ?
Crude Oil is a commodity and follows another cycle than the currencies.
One model to forecast next week... Back to basics... This is just the Sun position, geocentric, 10th harmonic to bring the period down to 36.53 days. The equity growth line is steady and growing. The time frame is 1 hour data, EST from my Oanda MT4 platform. Will consider other models to post if they look good....
Here is a Q spectrum wave model for next week and pulled out to show how the model performed over the past few weeks. 1 hr data EST. I ran it from 10 bars to 5000 bars and let auto extraction pick the highest 5 peaks.....
Here is another wave analysis, "Harmonic Box" derived from another, original spectrum analysis ... zoomed out to show both next week and the past 3 weeks....
Thanks for the comparison - can you show the Cycle indicator for the EURUSD chart too ? Crude Oil is a commodity and follows another cycle than the currencies. Sixer {image} {image}
Ignored
Hi Sixer,
in this indicator the "wavelength" - i.e. the period of cycles is not fixed. So what one does is selects a minimum of price and scales the period in order to match with, say, a next maximum.(depending on the timeframe of interest)
In other words, there is a free tuning parameter. I can select one, and somebody else can select another. Based on this indicator alone, I do not think a unique interpretation can be found.
What I wanted to show in the previous post is just that the calculation for the closed-source and free-source indicator is the same (and imho incorrect). I do not think I have actually identified the cycles in oil - I played with the indicator for just a few minutes.
Constantine Semenov wrote :
"Every currency has its own significator, or planet influencing its currency. Every currency
has its own major planet, for example Neptune for USD and Pluto for GBP"
I have received a request via email to post a study of the moon in Libra.
"I wonder if you would put up a chart [E. Hourly ] showing the Moon in Libra for as many months back as possible . Have you made any study on the effect of Moon in a particular sign [ bullish or bearish ] that is peculiar and attracting attention ???"
Here is hourly data (Chart 1) on EUR/USD EST showing the times Moon takes a position in Libra... a period lasting 2 1/2 days and one which happens once every lunar month. The mid-January occurrence seemed to have no effect, but one could say that there was a trend change in a weekly outlook around the time of this event.
The 2nd chart shows daily data and a longer term perspective.
"I wonder if you would put up a chart [E. Hourly ] showing the Moon in Libra for as many months back as possible
Ignored
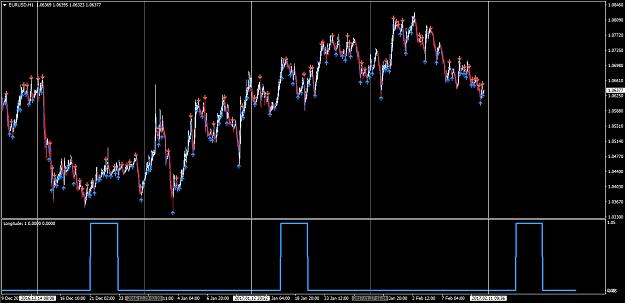
Just hacked together a quick unsolicited mt4 indicator. Using all the files for astro swiss library. One can select a heavenly body and the sign (i.e. celestial longitude; default moon in Libra).
{quote} Just hacked together a quick unsolicited mt4 indicator. Using all the files for astro swiss library. One can select a heavenly body and the sign (i.e. celestial longitude; default moon in Libra). astro_longitude.mq4;2184326 longitude.jpg;2184327 Cheers, k {file} {image}
Ignored
Wow.. K... this may be the most significant contribution to this thread ever.... This discussion of Moon in Libra came about because of my posts about Vertex in Libra which seemed to have a nice reaction every 24 hours... I looked at the code but didn't find a place to add Vertex to the list of heavenly bodies. Is it possible to add Vertex?
I have a request... I would love to find a script or EA that I could run on my Amazon VPS instance that could open and close then reverse trades based solely on time. I.E, at the start of the trading week, I could enter the time and date to go long or go short. Do you know of such an EA or would it be possible to write one? I would love to add that possibility to the forecasts I have been posting to legitimize the concept of posting an astro forecast for the following week. The "as traded" results I post at the end of the week would have more authority if I could just show what trades the EA opened and closed....
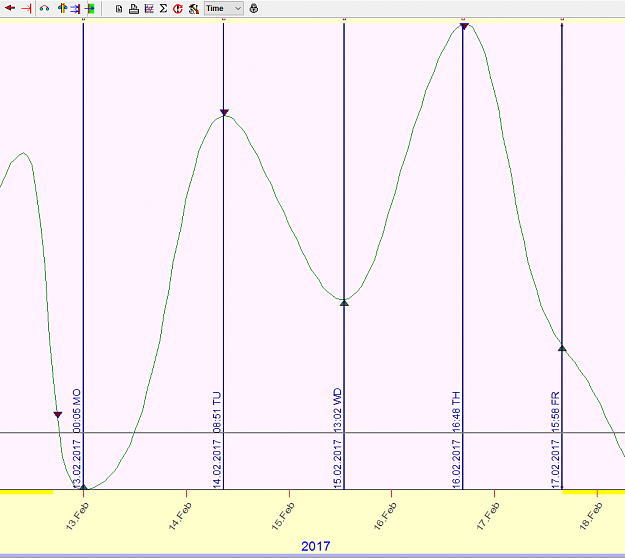
I wondered as a follow up what happens when the Moon enters the Cardinal houses of Aires, Cancer, Libra and Capricorn. The 4 cardinal points of 360 degrees are 0 or 360, 90. 180 and 270... these degrees correspond to the beginning of the Cardinal houses. each of these numbers add up to 9, i.e., 3+6+0=9, 1+8+0=9, etc... their subdivision also add up to 9 such as 45 degrees, 4+5=9, its subdivision, 22.5 degrees, 2+2+5=9, 11.25 degrees, 1+1+2+5=9... and so on... 180 +45=225 which also adds to 9, half of that is 112.5 degrees, also 9, and on and on...
From Wikipedia, " In astrology, an angular house, or cardinal house, is one of four cardinalhouses of the horoscope, which are the houses in which the angles of the chart (the Ascendant, the Midheaven, the Imum Coeli and the Descendant) are found. The angular houses of the horoscope are considered to be the most ardent, or forceful, and are considered to have the greatest impact in the chart. The influential 17th-century astrologer William Lilly states simply: "Planets in angles do more forcibly show their effects." [1] Angular houses rule those critical things in our life, such as our appearance and how we behave, our family life, our married life or partnerships, and our career"
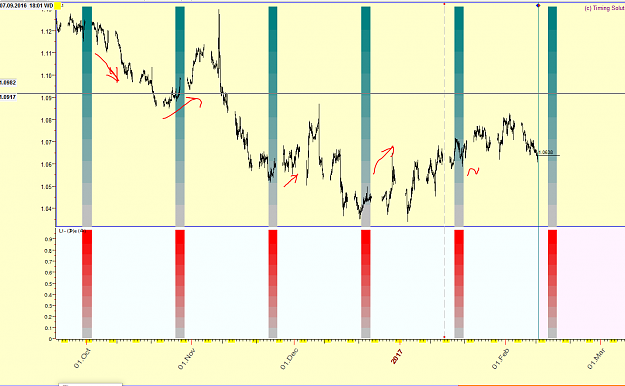
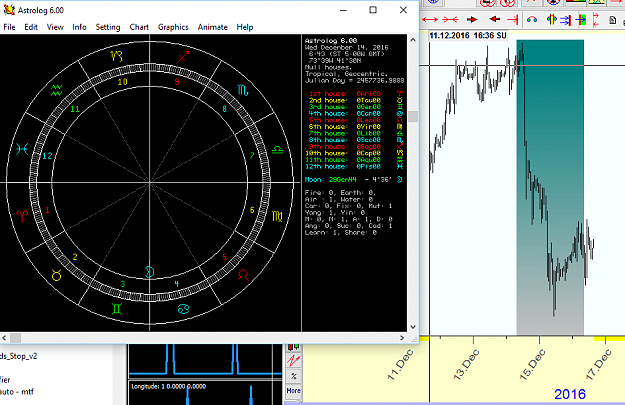
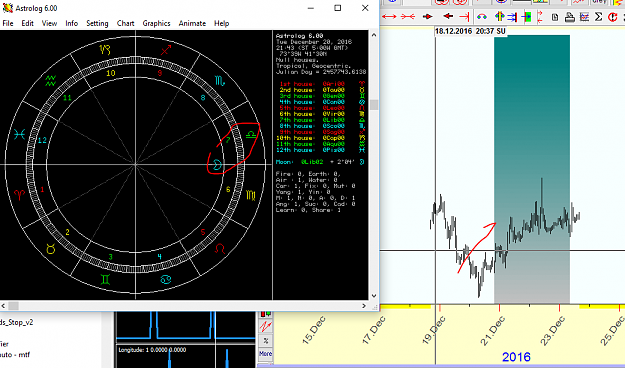
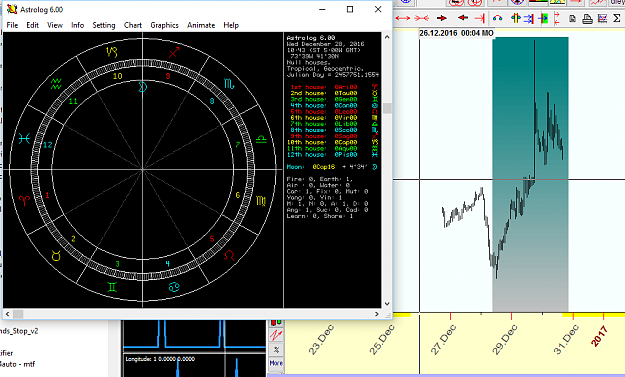
can you check if the infos mentioned in post #7833 are valid for january 2017 too.
I have marked the impotant highs and lows in the dec and jan charts.
Sixer
Edit:
The dates for feb would be interesting also.
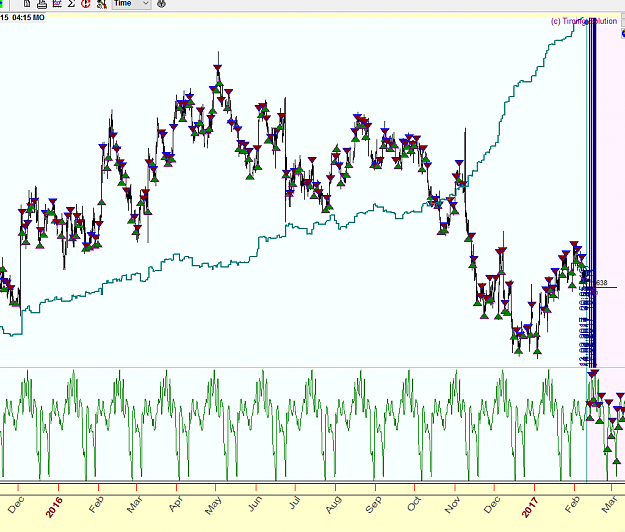
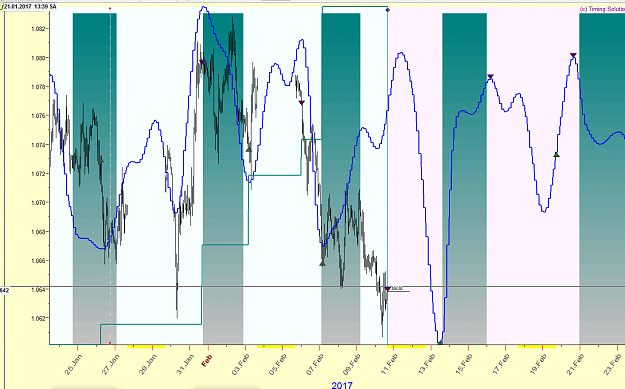
Jerry, can you check if the infos mentioned in post #7833 are valid for january 2017 too. I have marked the impotant highs and lows in the dec and jan charts. Sixer Edit: The dates for feb would be interesting also. {image} {image}
Ignored
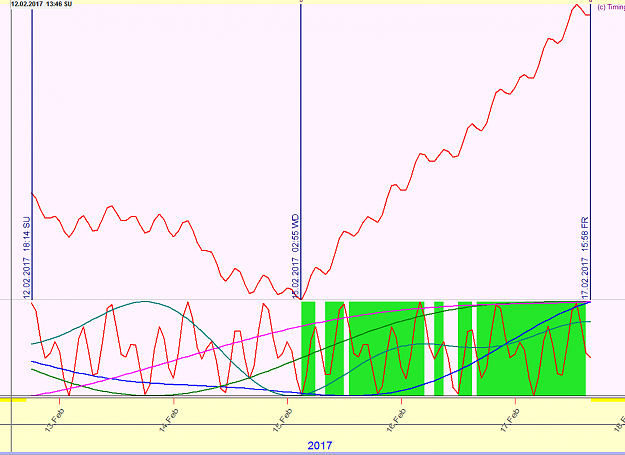
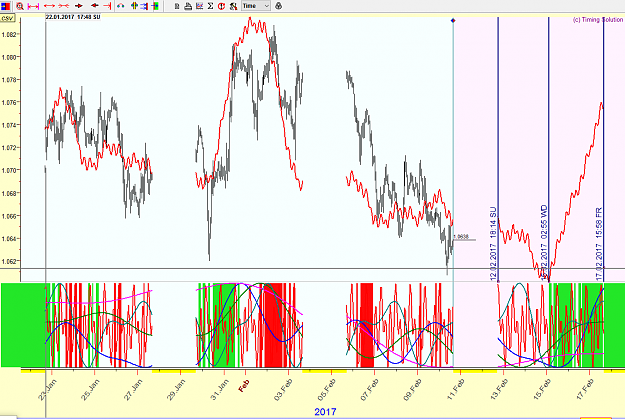
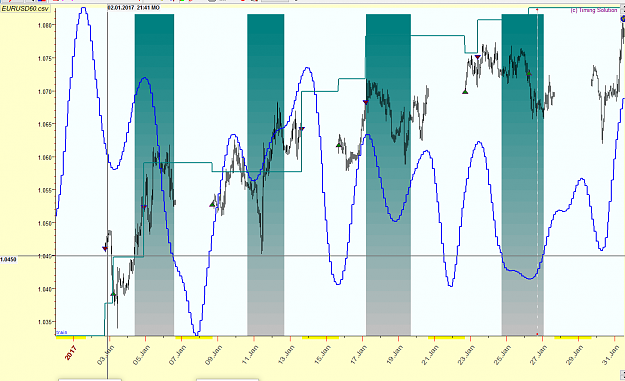
Here they are.... January and February The blue line is Jupiter-Saturn 32h Helio smooth orb 25% Auto RPO, v fast oscillator.. Buy and Sell signals are marked as well as the equity line.
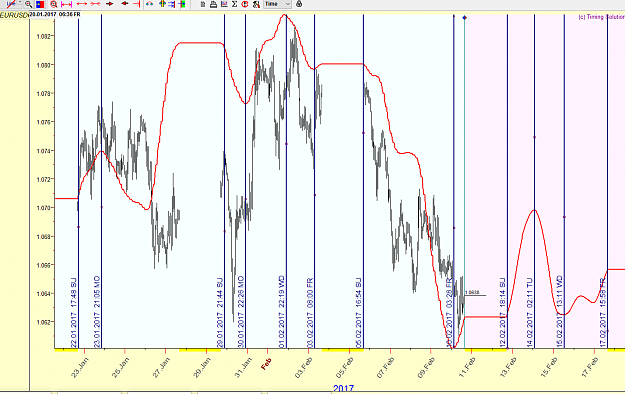
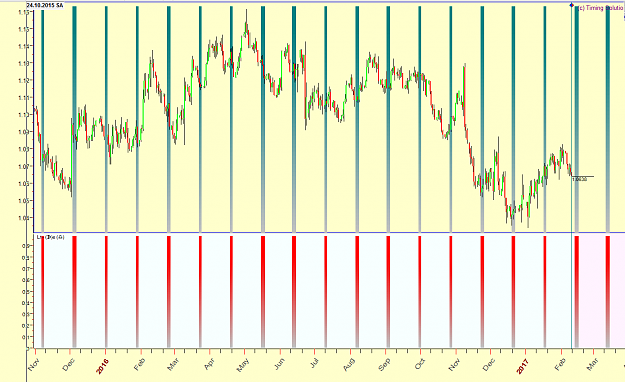
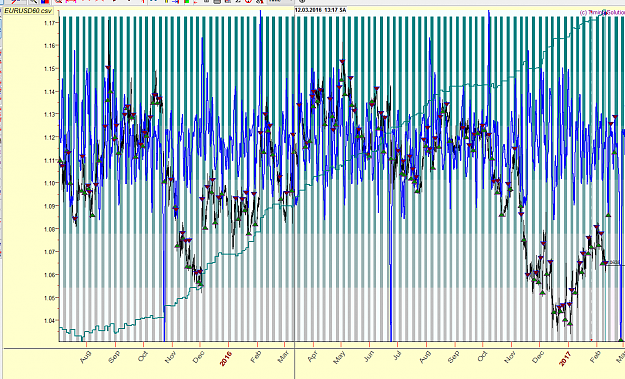
The above 2 charts are hourly data, EUR/USD, EST... Here is the bigger picture of the equity line growth going back to the beginning of this 10,000 bar data series from July 4, 2015 to the present.
Thanks for the kind words, I'll see what I can do.
Certainly it seems that the Vertex is calculated in a different coordinate system (topocentric) as it carries the notion of "west". So if I manage to do it, it will be a different indicator.
As for the EA, yes, that is possible, but I'll check if it hasn't already been done before.
I'll certainly try to get both done before the end of this week.
Cheers,
k
The above 2 charts are hourly data, EUR/USD, EST... Here is the bigger picture of the equity line growth going back to the beginning of this 10,000 bar data series from July 4, 2015 to the present. {image}
Ignored
Those are interesting posts but how realistic? Have seen the promotional info on that software but not familiar with its historical trading calculation.
Hourly bars?
Are entry fills based on bar open? What are exit fills based on, reversal of signal? What about stops, if any? Can't help but think those fills are highly optimized and in many cases too unrealistic.
If entry fills and subsequent reversals are based on simple bar openings with appropriate adjustment for offer prices on buys, it would be interesting to post a series of future buy/sell signals to get an idea of how accurate those signals really are.