• Home
  • Forums
  • Trades
  • News
  • Calendar
  • Market
  • Brokers
  • Login
  • Join
  • User/Email: Password:
  • 6:29pm
Menu
  • Forums
  • Trades
  • News
  • Calendar
  • Market
  • Brokers
  • Login
  • Join
  • 6:29pm
Sister Sites
  • Metals Mine
  • Energy EXCH
  • Crypto Craft

Options

Bookmark Thread

First Page First Unread Last Page Last Post

Printable Version

Similar Threads

Paradox system avg monthly ROR for last 12 months 31 replies

MTS Vs Random Entry - A Paradox 6 replies

lets talk about the system called PARADOX 2 replies

Parrondo's Paradox: A Study 7 replies

Newcomb’s paradox revisited? (Trading context) 2 replies

  • Trading Systems
  • /
  • Reply to Thread
  • Subscribe
  • 4,105
Attachments: The Paradox System
Exit Attachments

The Paradox System

  • Last Post
  •  
  • 1 396397Page 398399400 847
  • 1 Page 398 847
  •  
  • Post #7,941
  • Quote
  • Feb 9, 2017 6:38am Feb 9, 2017 6:38am
  •  Asker
  • | Joined Feb 2017 | Status: Member | 16 Posts
Quoting Copresents
Disliked
{quote} Wrong Broker
Ignored
@Copresents tnx
  • Post #7,942
  • Quote
  • Feb 9, 2017 8:08am Feb 9, 2017 8:08am
  •  Retrogue
  • Joined Feb 2017 | Status: Member | 229 Posts
Quoting crupent
Disliked
Re-entered for a short on the hit of parabolic. {image}
Ignored
Hi Crupent, Could I just check something on this trade if you wouldn't mind? From my knowledge so far of this system, the purple crossing white had eliminated the parabolic as resistance, but the attachment of the SAR meant this was a good trade as the H2 was in consolidation and the SAR bought you back into the trend for a short?

If I completely wrong please let me know and I will go back to the beginning and study again.
Never Give Up
  • Post #7,943
  • Quote
  • Feb 9, 2017 10:56am Feb 9, 2017 10:56am
  •  Elflaco
  • | Joined May 2016 | Status: Member | 132 Posts
For any newcomer in this thread, the advice below is the best you can have. I copied it from Shinny, post 4191:

Forget about trading and making trading decisions for the immediate future if your brand new here. Concentrate on studying, and referencing the charts with what you are learning, and also spend lots of time simply watching the charts and how they work. If you make trading decisions (even on demo) before you begin to understand the basics of the system it will have a detrimental effect on your progress because you will become frustrated with making losing trades and you will blame the system and you will give up and move on to something else - does that sound familiar to people?

Don't rush, the market is going nowhere, the time you spend now learning and studying will be the most important of your life. Right now you have nothing to gain and everything to lose by rushing and jumping too far ahead. Relax, study and once you start to understand the system start demo trading.


In this thread you will not only learn to trade this system, but also you will find a lot of tips about the mental attitude that you need to have to become a succesfull trader. You'll learn how to control your emotions and also how to eliminate greed, if you follow the rules.

When you start to study the thread you see Dove repeats many times there are no short-cuts. This not only goes for trading this system, but for learning also. Sure you can just study the summaries some of the fellow students made, but this is also a short-cut. There are hundreds of questions already asked and answered for you. You will find so many examples of good and bad trades and summaries only contain some of them. I don't say the summaries aren't helpfull, because they are, but if you start studying this thread, you need to study everything. And not just read through, but really study, and you probably have to study things over and over again to settle in. Maybe it sounds a little discouraging, as there are almost 400 pages to study, but on the other hand it's the only way to succeed.

Now when you start studying I recommend to always make sure you have visuals of the charts, so you know what everyone is talking about. If someone didn't upload a screenshot when they are talking about a trade, just look a couple of posts ahead and there is always a screenshot. Search for a chart and then look back at that particular situation and how the indicators were showing at the time. This way you will learn a lot about all the scenario's.

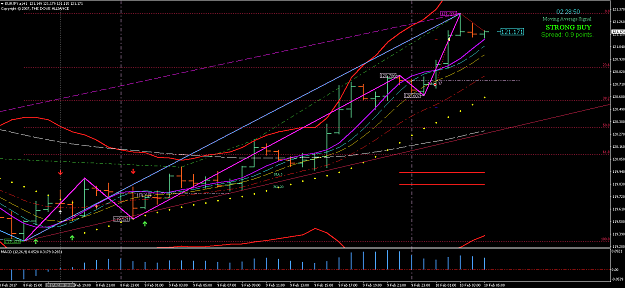
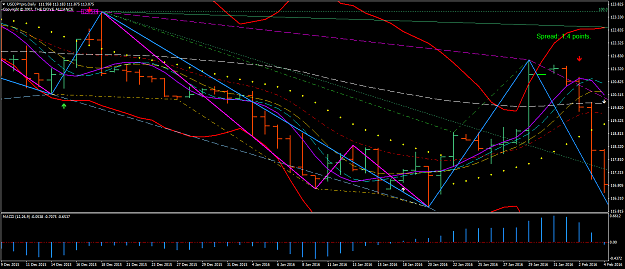
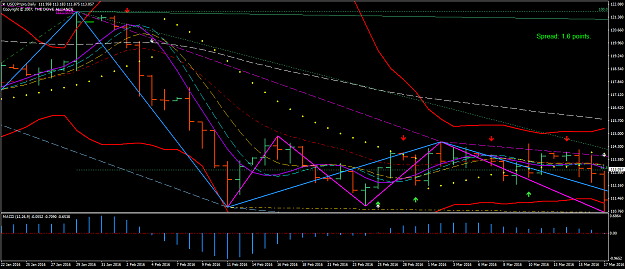
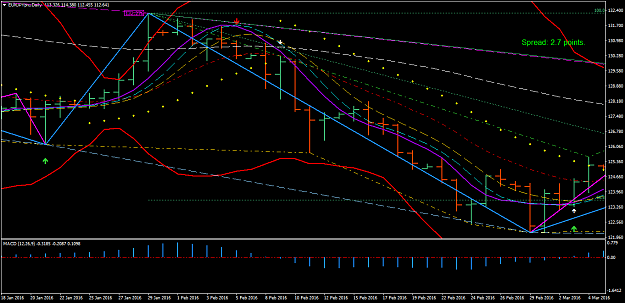
There is always a H2 chart you can find so you can get a visual when people discuss a trade, most of the times you will find a H1 chart as well. Daily charts you will find much less, especially the right ones with 6 bars per week. Below you will find the Daily charts for USDJPY and EURJPY from a year ago (for the first 300 pages of the thread), so you can always keep track of what is happening on the Daily, except for the Daily Fibo. But it still will be very usefull in learning, having that lying next to you studying trading plans and trades.
Attached Images (click to enlarge)
Click to Enlarge

Name: USDJPYproDaily 09-12-2015 tm 04-02-2016.png
Size: 62 KB Click to Enlarge

Name: USDJPYproDaily 22-01-2016 tm 18-03-2016.png
Size: 56 KB Click to Enlarge

Name: Overview Daily 18-01-2016 tm 05-03-2016 EURJPYproDaily.png
Size: 48 KB Click to Enlarge

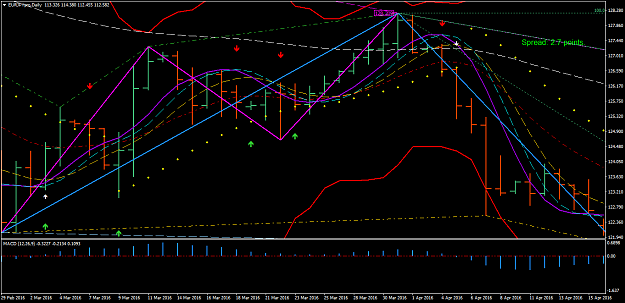
Name: Overview Daily 29-02-2016 tm 16-04-2016 EURJPYproDaily.png
Size: 54 KB
8
  • Post #7,944
  • Quote
  • Feb 9, 2017 11:12am Feb 9, 2017 11:12am
  •  Contrax
  • Joined Sep 2013 | Status: Member | 991 Posts
Quoting Retrogue
Disliked
{quote} Hi Crupent, Could I just check something on this trade if you wouldn't mind? From my knowledge so far of this system, the purple crossing white had eliminated the parabolic as resistance, but the attachment of the SAR meant this was a good trade as the H2 was in consolidation and the SAR bought you back into the trend for a short? If I completely wrong please let me know and I will go back to the beginning and study again.
Ignored

You need to see all the Picture.. Not only the SAR things. Yes, White crossing Purple removes the Resistance/Support of Parabolic but DOESNT remove the Parabolic Trend. Just take a look what happen when H1 and H2 is in sync, is the reason that Dana always say about H1 is reference chart and H2 is Trading Chart.

For example if in H1 you have 4 horsemen UP and Parabolic Trending Up.

And then in H2 you have for example, Smooth and White crossing purple for the Up near EMA (EMA still Resistance) but Parabolic in current candle the Parabolic is Flipping and the Market is with SAR TOP for the Down. You have to take care to short it, because that Current Candle can close with Parabolic Flip to Button, confirming the Parabolic Trend Up, and Then you have H1 H2 parabolic trend in Sync and that is pushing up more the market. If the market now is showing the parabolic trends in sync, with ur EMA Arrow Alert is going UP and you are going to loss your Short Trade from SAR thinking that is going go down (But again, you need to see all the whole picture ROMAR in H2 D1, the space of minium 40 pips for SL and TP gap, etc...) And in this example when the things is going up, you only need to wait for the market retrace to the Supports 4 horsemen and place ur buy order. You have your 40SL pips behind of the supports, and see if ur 40tp target isnt any resistance in there.

But of course every scenario is different and u need to see the moment.

Every new candle can change the scenario and you have to do your: "Notes for readjustments:"

And a simple readjustments is for example if u have Red Arrow EMA in H2 in your plan, and 2 candles after appear and set in a stone a Green Arrow ema, you must make readjustments for dont loss the focus at the moment.

But again is speaking myself and if Dana says that im wrong, im just wrong.
3
  • Post #7,945
  • Quote
  • Feb 9, 2017 11:26am Feb 9, 2017 11:26am
  •  Retrogue
  • Joined Feb 2017 | Status: Member | 229 Posts
Quoting Contrax
Disliked
{quote} You need to see all the Picture.. Not only the SAR things. Yes, White crossing Purple removes the Resistance/Support of Parabolic but DOESNT remove the Parabolic Trend. Just take a look what happen when H1 and H2 is in sync, is the reason that Dana always say about H1 is reference chart and H2 is Trading Chart. For example if in H1 you have 4 horsemen UP and Parabolic Trending Up. And then in H2 you have for example, Smooth and White crossing purple for the Up near EMA (EMA still Resistance) but Parabolic in current candle the Parabolic...
Ignored
Thank you very much for your detailed reply Contrax
Never Give Up
  • Post #7,946
  • Quote
  • Feb 9, 2017 12:41pm Feb 9, 2017 12:41pm
  •  canoe
  • | Joined Feb 2016 | Status: Member | 4 Posts
can someone recommend me a broker besides forex.com that is compatible with the paradox mt4 displaying correctly?

this is a question for shaun:

Under full disclosure, I have not thoroughly studied this system. But I'd like to ask: Is it possible to become a better trader by learning this system? The reason why I ask this is because this system seems to be so highly dependent on the rules set forth. Those rules aren't easy to master and like Dana says, I assume it takes almost a year to master the rules. But, they are rules nonetheless. More than anything, I want to grow as a trader. I don't want to just become someone who is only highly skilled in the "Paradox system" because then, my entire worth as a trader is 100% dependent on a system that I don't conceptually understand (since I never programmed it). Some day, the system may not work (like all trading systems). Some day, mt4 support might disappear.

Anyways, my point is, I want to grow as a trader by enhancing my education on the subject of "trading." Would learning the Paradox allow me to become a better trader even without the Paradox?

To everyone else, I'd just like to point out that there is no "holy grail" trading system. The best thing you can do is to invest in your own education. Things change all the time and that includes markets and trading systems. Success will be contingent upon being able to successfully adapt to change and you can only rely on yourself to do that in such times. If a particular trading system helps you to become a better trader overall, then by all means, learn all that you can from that system. But never stop growing and focusing on your own skill set. Use what you learned from that system and take bits and pieces from it and add them into your own arsenal. My hope is for everyone in this thread to become self-sufficient traders one day. Take control of your destiny because when shit hits the fan, no one will be there to extend you a hand except yourself.
  • Post #7,947
  • Quote
  • Feb 9, 2017 2:05pm Feb 9, 2017 2:05pm
  •  nigpig
  • Joined Feb 2016 | Status: Member | 371 Posts
Hello Canoe. Forex.com are the best I have found out of six I have tried. That's all I can say. I'm sure other traders can help. You sound as if you have been around but this is your first post on FF?

In regards to your question, from my own personal experience, you wont find a better system than the Paradox for learning how to trade. I have learnt more from the Paradox than any other trading system I have tried and I have tried a few. The simple reason is an understanding of support and resistance on the different time frames.

There is a dependence on the indicators, but Dana has said that there is no need to think about MT5 forced upgrade, and if it did happen he would do it or that is what I understand. But MT4 will be around for a long time as long as brokers continue to support it and traders want it in preference.

From your last paragraph they are wise words, but I feel you you have a point to make on your agenda.
  • Post #7,948
  • Quote
  • Feb 9, 2017 4:47pm Feb 9, 2017 4:47pm
  •  Hendo
  • Joined Jan 2017 | Status: Member | 122 Posts
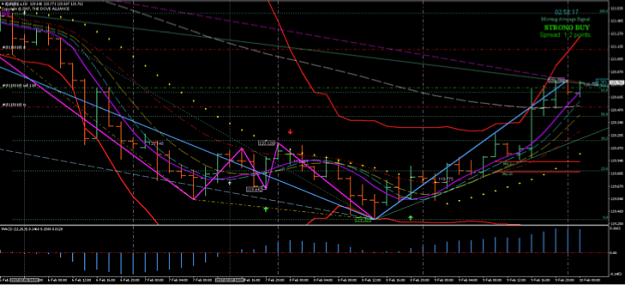
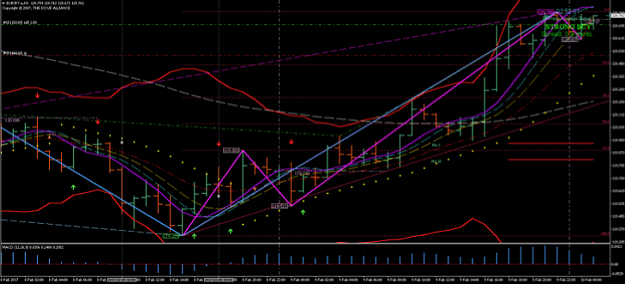
Last nights trade plan, entry, result, and evaluation after trade closed per Dove's instructions.


Session Sydney : EUR/JPY 2/8/2017

Daily Open : Below Purple.
Romar: Resistance
EMA: Resistance
Parabolic: Resistance
Notes: Four Horsemen in steep downtrend. Purple, White, and Smooth crossed Romar. DB down with Blue divergence attachment with green price tag. Fibo up.

H1
Romar: Resistance
EMA: Support
Parabolic: Support
Notes: Four Horsemen in strong up trend. Trend EMA arrow up. MA crossover arrow up. MACD zero cross arrow up. Fibo up.

H2
Romar: Resistance
EMA: Support
Parabolic: Support
Notes: Purple crossed White, Smooth, and EMA up. DB, SAR, Green, Gold Divergence hit off BB with green price tag. Fibo up. Last MACD zero cross arrow up. Trend EMA arrow up. PSAR flipped up. SAR attached with price tag.

FINAL NOTES:H1, H2 up, Will enter long off H2 support after up trend is confirmed by Purple crossing EMA, and PSAR stays down for the up.

Buy: Entered long off retrace to 23.6 Fibo. Set TP +40 SL40

Result: Took +40 pips from the market.

Evaluation: Felt very confident taking this trade Went to sleep after placing, even with SAR attached at entry I felt good about it going up then, DB attaching. Upon review this afternoon, I could have been more patient with my entry. If I could have stayed up later, I definitely would have entered long with the next open candle at Purple. All in all a good trade, didn’t lose any sleep, and was nice waking up to +40 pips!


Chad,
Attached Images (click to enlarge)
Click to Enlarge

Name: Screenshot1.png
Size: 469 KB Click to Enlarge

Name: Screenshot2.png
Size: 438 KB
3
  • Post #7,949
  • Quote
  • Edited at 10:49pm Feb 9, 2017 5:31pm | Edited at 10:49pm
  •  OliveBranch
  • Joined Feb 2017 | Status: Member | 356 Posts | Invisible
Hello traders. My trading plan for today is as follows:
DAILY CHART - DATE: 9 Feb 2017 NY 1725hrs Sydney time 0825hrs
Date: 10-2-17, 17:00 ET
EU/JPY
Daily:
ROMAR: Resistance
EMA: Resistance
PSAR: Resistance
Check List:
Last MACD 0 crossing: Down
Last EMA Alert Arrow: White Down
Last DB Attachment: 119.325 Bottom
Fibo: Green Up
Notes: 4 Horsemen trend down Sky Blue DB Attachment 119.325
2 HR:
ROMAR: Support
EMA: Support
PSAR: Support
Check List:
Last MACD 0 crossing: Up
Last EMA Alert Arrow: Green Up
Last DB Attachment: 119.325
Last SAR Attachment: 119.325
Fibo: Green Up
Notes: 4 horsemen trend up DN attachment below 4 horsemen. Candle open above Purple. Trend is up
1 HR:
ROMAR: Support
EMA: Support
PSAR: Support
Check List:
Last MACD 0 crossing: Up
Last EMA Alert Arrow: Up
Fibo up or down: Down
SAR: Peaked at high 120.786
Notes:. Trend is up yet SAR has hit 0.0 SAR & Fibo indicate a down trend. White and smooth may cross for early change into down trend.
Final Notes: Consolidation chart. Daily trend Down. 1 & 2 hr trend up, with 1hr possible early stage down trend.
Entry: Wait for Fibo flip on 1 hr chart and go long 40 pips.
Wait for white cross purple on 1 hr chart and short for 20 pips
Attached Images (click to enlarge)
Click to Enlarge

Name: Screenshot1.png
Size: 197 KB Click to Enlarge

Name: Screenshot2.png
Size: 177 KB
If you make up your own rules then the story is sad.....
  • Post #7,950
  • Quote
  • Feb 9, 2017 5:49pm Feb 9, 2017 5:49pm
  •  OliveBranch
  • Joined Feb 2017 | Status: Member | 356 Posts | Invisible
Quoting Hendo
Disliked
Last nights trade plan, entry, result, and evaluation after trade closed per Dove's instructions. Session Sydney : EUR/JPY 2/8/2017 Daily Open : Below Purple. Romar: Resistance EMA: Resistance Parabolic: Resistance Notes: Four Horsemen in steep downtrend. Purple,
.....................Upon review this afternoon, I could have been more patient with my entry. If I could have stayed up later, I definitely would have entered long with the next open candle at Purple. All in all a good trade, didnt lose any sleep, and was nice waking up to +40 pips! Chad,...
Ignored
Nice work. Well done Chad.
If you make up your own rules then the story is sad.....
  • Post #7,951
  • Quote
  • Feb 9, 2017 6:23pm Feb 9, 2017 6:23pm
  •  dove_alliance
  • Joined Jun 2007 | Status: Trading Live For The Last 14 Years. | 5,761 Posts
Quoting Hendo
Disliked
Last nights trade plan, entry, result, and evaluation after trade closed per Dove's instructions. Session Sydney : EUR/JPY 2/8/2017 Daily Open : Below Purple. Romar: Resistance EMA: Resistance Parabolic: Resistance Notes: Four Horsemen in steep downtrend. Purple, White, and Smooth crossed Romar. DB down with Blue divergence attachment with green price tag. Fibo up. H1 Romar: Resistance EMA: Support Parabolic: Support Notes: Four Horsemen in strong up trend. Trend EMA arrow up. MA crossover arrow up. MACD zero cross arrow up. Fibo up. H2 Romar: Resistance...
Ignored
Thank you Chad for posting your trade. Your plan and execution was with proficiency.

What makes Chad a very extraordinary trader is because he has heart. Here is a traders realizing the only way to make it in the Forex Market is in learning how to beat the market. Chad does not analyze anything but only follow the rules of trading beginning with a treading plan. He does not jump around trying to find short-cuts but only staying with his objective in believing, having faith, and totally dependent the Paradox will not let him down. It takes a lot of heart and faith to reach this plateau. A plateau of not deviating his true objective of becoming one of the 5%.

On his trade he was patient waiting on the EMA crossing Purple before pulling the trigger. The reason was because the H1 was already in full bloom of the uptrend with the 4 Horsemen; and with the H2 EMA crossing would place both H1 and H2 in the 4 horsemen trend. This also told him the Ranging Mode was over and the breakout was going north. He also knew by applying the rules the trend would override everything else. That is pure faith knowing the truth would prevail. And Chad proved this by pulling the trigger and then went to bed.

Chad is a great example of what makes a great trader. And he would be the first stating he has much more to learn. But no-matter what - he is on the right road of success.

And so everyone knows - I took the same trade - the only difference was I waited on the next open candle.
The Dove - Forex Trainer
3
  • Post #7,952
  • Quote
  • Feb 9, 2017 6:24pm Feb 9, 2017 6:24pm
  •  dove_alliance
  • Joined Jun 2007 | Status: Trading Live For The Last 14 Years. | 5,761 Posts
Quoting OliveBranch
Disliked
Hello traders. My trading plan for today is as follows: DAILY CHART - DATE: 9 Feb 2017 NY 1725hrs Sydney time 0825hrs Date: 10-2-17, 17:00 ET EU/JPY Daily: ROMAR: Resistance EMA: Resistance PSAR: Resistance Check List: Last MACD 0 crossing: Down Last EMA Alert Arrow: White Down Last DB Attachment: 119.325 Bottom Fibo: Green Up Notes: 4 Horsemen trend down Sky Blue DB Attachment 119.325 2 HR: ROMAR: Support EMA: Support PSAR: Support Check List: Last MACD 0 crossing: Up Last EMA Alert Arrow: Green Up Last DB Attachment: 119.325 Last SAR Attachment:...
Ignored
OliveBranch - you need to post charts and not PDF's.
The Dove - Forex Trainer
  • Post #7,953
  • Quote
  • Feb 9, 2017 6:50pm Feb 9, 2017 6:50pm
  •  Hendo
  • Joined Jan 2017 | Status: Member | 122 Posts
Thank you Dana, you are right, I still do have much to learn. However, my faith in the paradox is absolute. I believe in this system, it has been proven over, and over again by you as well as Shaun. For those who have come and gone and come back again, I was here in the beginning in the back ground observing. I was looking for short cuts like the other 95% of losing traders. After watching Dana and Shaun, I decided to take my time and learn this system no short cuts. After I was 80% wins I started to post trading plans and have not lost a trade. Although, my first post was against my plan, the trade was a winner, but was a loser as far as Dana was concerned. I take everything he says to heart so, I went back brushed up on the only thing I was lacking and that was absolute faith in this system. Now I feel I am very close to being a very good top 5% professional trader. As Randy stated in the beginning I do feel as though we've all been given the keys to the kingdom, what you decide to do with it is up to you! With that said, count on it taking at least six months to fully grasp the power of this system!

Best Regards,

Chad
7
  • Post #7,954
  • Quote
  • Feb 9, 2017 7:26pm Feb 9, 2017 7:26pm
  •  Contrax
  • Joined Sep 2013 | Status: Member | 991 Posts
This was my trade of yesterday but i still have a question because i dont know if was correct or not the magnament with the News.

With the trade we had today in the morning Red News:

TIME NEWS:

7:30am USD Unemployment Claims


And the trade was still runing but i was sure that the price was going up, and i place my SL in a breakeven in case of the news had a really big impact. Most of time i close my trade before the news (FOMC, NON FARM, GDP, RETAIL SALES).

I see we took the same trades and we let it run after the Unemployment Claims news.
Attached Image (click to enlarge)
Click to Enlarge

Name: trade.png
Size: 70 KB
  • Post #7,955
  • Quote
  • Feb 9, 2017 8:36pm Feb 9, 2017 8:36pm
  •  OliveBranch
  • Joined Feb 2017 | Status: Member | 356 Posts | Invisible
Quoting dove_alliance
Disliked
{quote} OliveBranch - you need to post charts and not PDF's.
Ignored
Thanking you. I thought i had been doing this as another trader has said the same thing in 1st post i made. Will try again, On my system lately the files for upload now are .png
If you make up your own rules then the story is sad.....
  • Post #7,956
  • Quote
  • Edited at 10:53pm Feb 9, 2017 8:39pm | Edited at 10:53pm
  •  OliveBranch
  • Joined Feb 2017 | Status: Member | 356 Posts | Invisible
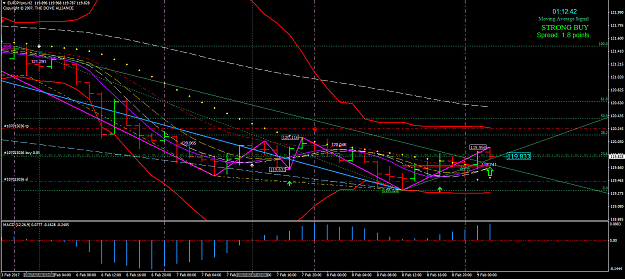
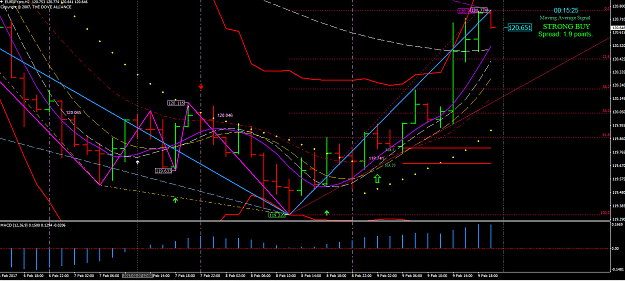
Evaluation at pull trigger moment: pulled the trigger during the active 1hr candle. Check rules to see if I was supposed to wait till close of 1hr candle for crossing of purple & white. Not sure I did the right thing.
Evaluation At closing of trade:
At the 1hr opening it is clearly demonstrated that the purple did not in fact cross white and instead both white & purple continued in trend. The correct trade entry in the moment at that time (the close of the opening of the next 1hr candle was therefore for a long entry as both the 1hr & 2hr charts would be in consensus for trend up.
Stopped out at 40 pip loss. Traded mid-candle instead of on candle opening on the 1hr chart and against the 2 hr trend. Therefore I did not apply the rules correctly and counter traded against trend and was rightly punished.
Quote from Dove for my reference You have to always remember the 2hr is your TREND chart and the 1hr is your reference for entry with the 2hr. For a good trade to be established is when the 1hr 4 horsemen are in sync with the 2hr. In other words; they both are in the same direction. Otherwise you will be counter trading for a loss.
Attached Images (click to enlarge)
Click to Enlarge

Name: Screen Shot 2017-02-10 at 1.30.50 PM.png
Size: 84 KB Click to Enlarge

Name: Screen Shot 2017-02-10 at 1.31.03 PM.png
Size: 78 KB
If you make up your own rules then the story is sad.....
  • Post #7,957
  • Quote
  • Feb 9, 2017 8:50pm Feb 9, 2017 8:50pm
  •  OliveBranch
  • Joined Feb 2017 | Status: Member | 356 Posts | Invisible
Quoting OliveBranch
Disliked
{quote} Thanking you. I thought i had been doing this as another trader has said the same thing in 1st post i made. Will try again, On my system lately the files for upload now are .png
Ignored
Hello people, it seems i am still having a problem posting screenshots despite my files telling me they are .png's. If someone has the time would you mind PM myself and advise suggestions for rectifying my problems?
If you make up your own rules then the story is sad.....
  • Post #7,958
  • Quote
  • Feb 9, 2017 8:52pm Feb 9, 2017 8:52pm
  •  dove_alliance
  • Joined Jun 2007 | Status: Trading Live For The Last 14 Years. | 5,761 Posts
Quoting OliveBranch
Disliked
{quote} Thanking you. I thought i had been doing this as another trader has said the same thing in 1st post i made. Will try again, On my system lately the files for upload now are .png
Ignored
What you do is right click on your chart and scroll to Save As Picture. Then give it a name and place it in a document folder you see in the widow (be sure to create a folder you want your screen shots in).

When you are posting your chart you created you go to the bottom of post window and click "Upload From Device" (device is your computer). Find the screen shot and click it - then click open and It will upload it. Then click "Insert" and it will insert the screen shot with a code.
The Dove - Forex Trainer
  • Post #7,959
  • Quote
  • Feb 9, 2017 10:51pm Feb 9, 2017 10:51pm
  •  OliveBranch
  • Joined Feb 2017 | Status: Member | 356 Posts | Invisible
Quoting dove_alliance
Disliked
{quote} What you do is right click on your chart and scroll to Save As Picture. Then give it a name and place it in a document folder you see in the widow (be sure to create a folder you want your screen shots in). When you are posting your chart you created you go to the bottom of post window and click "Upload From Device" (device is your computer). Find the screen shot and click it - then click open and It will upload it. Then click "Insert" and it will insert the screen shot with a code.
Ignored
Done. Easy as. Thanking you for your assistance.
If you make up your own rules then the story is sad.....
  • Post #7,960
  • Quote
  • Feb 10, 2017 12:08am Feb 10, 2017 12:08am
  •  Elflaco
  • | Joined May 2016 | Status: Member | 132 Posts
Quoting MusicAndGod
Disliked
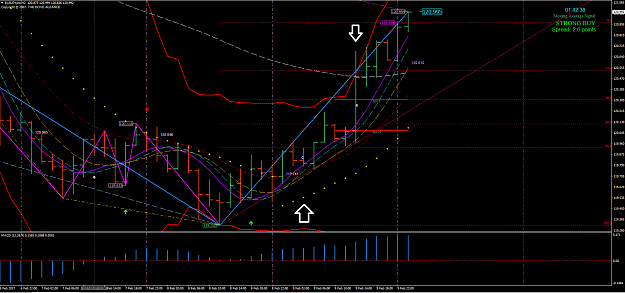
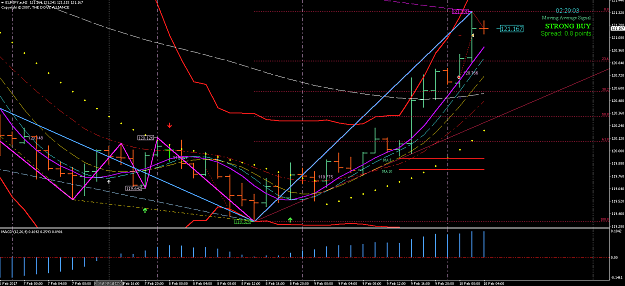
{quote} Entered short around the 0.0 fibbonaci level, even though 4 horsemen shooting up. Why? I noticed SAR attached at the top of a candle at level 121.321 on the DAILY without DB (Hinting a retrace on the downside will occur). Also, green divergence attached on 2H candle. Photos below showing my proof of entry (Both 2H and Daily as a visual representation). I tried my best to trade in this moment. God bless you all. {image} {image}
Ignored
You always want to look for confluence before entering a trade. You depended solely on the Daily SAR attachment, and going against the trend.

By the way, there is no Green divergence showing on H2 on my chart and I don't see it on the one you posted either.
  • Trading Systems
  • /
  • The Paradox System
  • Reply to Thread
    • 1 396397Page 398399400 847
    • 1 Page 398 847
0 traders viewing now
  • More
Top of Page
  • Facebook
  • Twitter
About FF
  • Mission
  • Products
  • User Guide
  • Media Kit
  • Blog
  • Contact
FF Products
  • Forums
  • Trades
  • Calendar
  • News
  • Market
  • Brokers
  • Trade Explorer
FF Website
  • Homepage
  • Search
  • Members
  • Report a Bug
Follow FF
  • Facebook
  • Twitter

FF Sister Sites:

  • Metals Mine
  • Energy EXCH
  • Crypto Craft

Forex Factory® is a brand of Fair Economy, Inc.

Terms of Service / ©2021