• Home
  • Forums
  • Trades
  • News
  • Calendar
  • Market
  • Brokers
  • Login
  • Join
  • 6:41am
Menu
  • Forums
  • Trades
  • News
  • Calendar
  • Market
  • Brokers
  • Login
  • Join
  • 6:41am
Sister Sites
  • Metals Mine
  • Energy EXCH
  • Crypto Craft

Options

Bookmark Thread

First Page First Unread Last Page Last Post

Print Thread

Similar Threads

Planetary cycles, astrological theory of cycles of the markets 508 replies

Opinions on "Planetary cycles, astrological theory .. of the markets" 41 replies

Forecast Forex using Numeric Cycles and Astrology Cycles 36 replies

Planetary / Astrology indicators 3 replies

Planetary Cycles... Plotting Cycles into the Future 0 replies

  • Interactive Trading
  • /
  • Reply to Thread
  • Subscribe
  • 5,901
Attachments: Planetary Cycles Trading (EUR/USD)
Exit Attachments
Tags: Planetary Cycles Trading (EUR/USD)
Cancel

Planetary Cycles Trading (EUR/USD)

  • Last Post
  •  
  • 1 387388Page 389390391 680
  • 1 Page 389 680
  •  
  • Post #7,761
  • Quote
  • Feb 3, 2017 5:58pm Feb 3, 2017 5:58pm
  •  jnevins
  • Joined Feb 2007 | Status: Member | 2,660 Posts
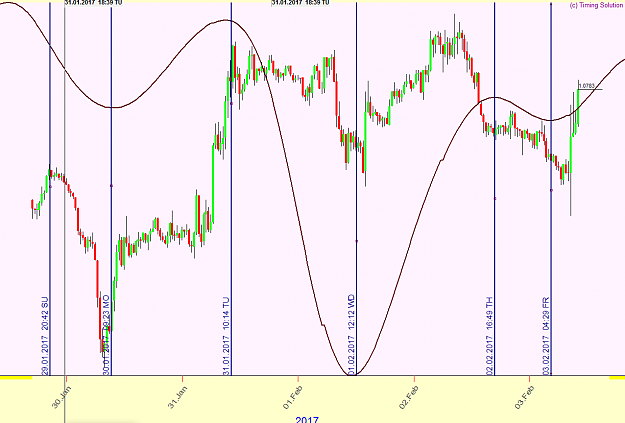
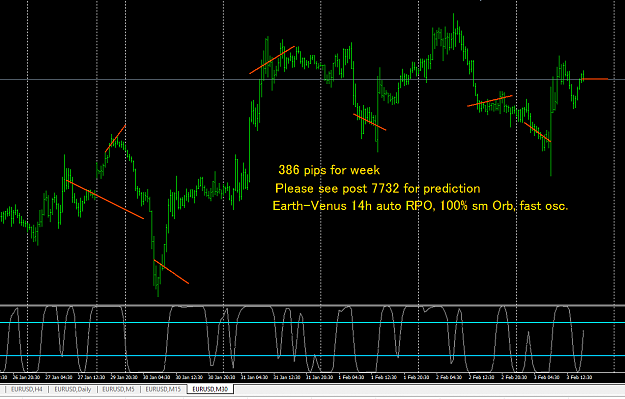
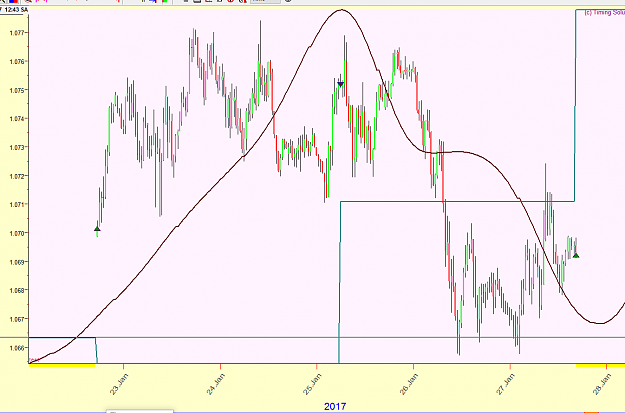
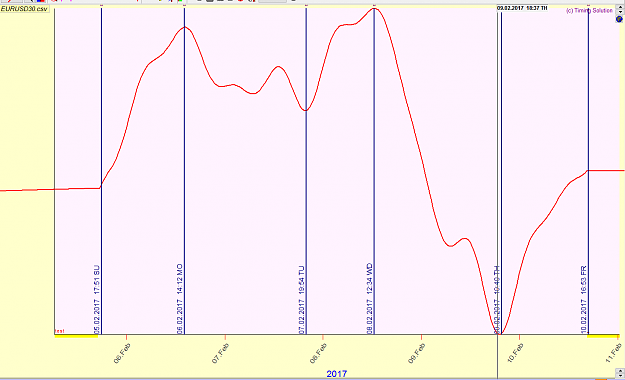
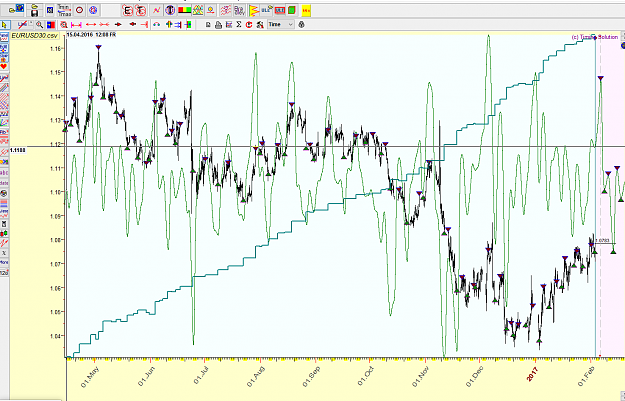
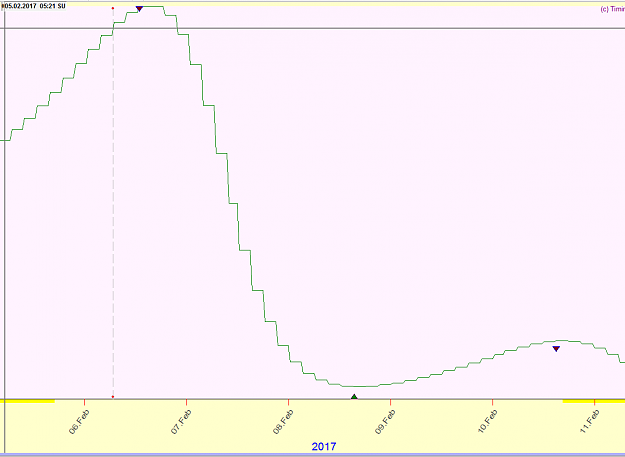
Still here! Subbu's answer was correct so I didn't jump in. Have been very busy with my college students this week. Here is the end of the week report. Earth -Venus helio saved the day this week and the Uranus model was not as accurate... Take a look at post 7732 for the prediction....

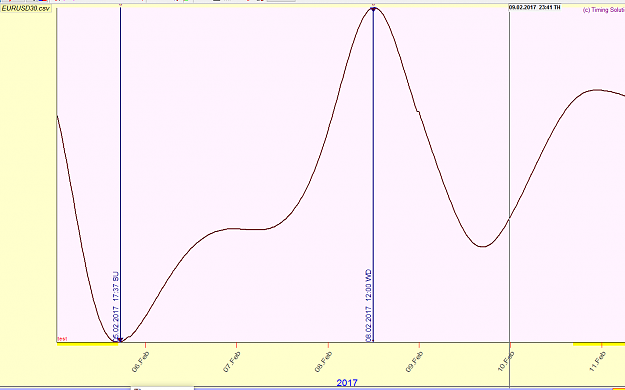
Data: 30 min EUR/USD, EST.
Attached Image(s) (click to enlarge)
Click to Enlarge

Name: Capture.PNG
Size: 61 KB
Click to Enlarge

Name: Capture1.PNG
Size: 51 KB
 
 
  • Post #7,762
  • Quote
  • Feb 3, 2017 6:19pm Feb 3, 2017 6:19pm
  •  jnevins
  • Joined Feb 2007 | Status: Member | 2,660 Posts
I have been spending time working on looking at the overall equity line for the entire data series of 10,000 30 min bars this week. Timing Solution can place buy and sell arrows on the chart. Here is a view of the entire data series. The equity growth line is the blue-green line showing steady growth. It assumes each trade was taken as indicated by the green and violet arrows.

The second chart shows the week of Jan 16-20 with Earth-Venus line and the Equity growth line and arrows placed automatically by TS.

I would love to know if there is an EA for MT4 out there that will place trades during the week, long and short, always in the market that one could enter the buy and sell data before the market opens for the week....Any suggestions? Anyone know a programmer that could work on this?
Attached Image(s) (click to enlarge)
Click to Enlarge

Name: Capture2.PNG
Size: 190 KB
Click to Enlarge

Name: Capture3.PNG
Size: 74 KB
 
 
  • Post #7,763
  • Quote
  • Feb 3, 2017 6:24pm Feb 3, 2017 6:24pm
  •  jnevins
  • Joined Feb 2007 | Status: Member | 2,660 Posts
Here is the following week with the LBC (the last bar visible to TS, pink background) set to the closing bar of the previous week... notice the equity curve stepping up and the accuracy of the trades...Earth-Venus helio 14th harmonic.
Attached Image (click to enlarge)
Click to Enlarge

Name: Capture4.PNG
Size: 64 KB
 
 
  • Post #7,764
  • Quote
  • Feb 3, 2017 6:28pm Feb 3, 2017 6:28pm
  •  jnevins
  • Joined Feb 2007 | Status: Member | 2,660 Posts
Finally here is next week... Long until noon EST on Wednesday then Short and hold short until the Following Wednesday, Feb 15 at 9:10 am.... Same model as above, Earth-Venus 14h Heliocentric, 100% smooth orb, fast oscillator and Auto RPO.
Attached Image(s) (click to enlarge)
Click to Enlarge

Name: Capture.PNG
Size: 30 KB
Click to Enlarge

Name: Capture1.PNG
Size: 11 KB
 
 
  • Post #7,765
  • Quote
  • Edited 10:30pm Feb 3, 2017 10:20pm | Edited 10:30pm
  •  jnevins
  • Joined Feb 2007 | Status: Member | 2,660 Posts
Next week with more sub trades.... The swing in buy/sell was set to 2%.
Attached Image (click to enlarge)
Click to Enlarge

Name: Capture.PNG
Size: 31 KB
 
 
  • Post #7,766
  • Quote
  • Feb 4, 2017 12:10am Feb 4, 2017 12:10am
  •  jnevins
  • Joined Feb 2007 | Status: Member | 2,660 Posts
As an experiment, here is a neural net projection based on 1,50,50 smoothed oscillator and the top 3 extracted cycles from the spectrum module and run through 50k training cycles... will compare models at the end of the week.
Attached Image (click to enlarge)
Click to Enlarge

Name: Capture.PNG
Size: 40 KB
 
 
  • Post #7,767
  • Quote
  • Feb 4, 2017 1:57am Feb 4, 2017 1:57am
  •  Sixer
  • Joined Nov 2008 | Status: Member | 1,757 Posts
The Intermediate and Medium Term Delta counts indicate a further upmove too.

Sixer
Attached Image
 
 
  • Post #7,768
  • Quote
  • Feb 4, 2017 9:01am Feb 4, 2017 9:01am
  •  Forexbuddy87
  • | Joined Jan 2017 | Status: Member | 25 Posts
Quoting Sixer
Disliked
The Intermediate and Medium Term Delta counts indicate a further upmove too. Sixer {image}
Ignored
Is that a special software to calculate delta. I love the theory but couldn't figure out how to apply it for the life of me :/
 
 
  • Post #7,769
  • Quote
  • Feb 4, 2017 2:52pm Feb 4, 2017 2:52pm
  •  F.g
  • Joined Aug 2016 | Status: Member | 6,962 Posts
Quoting Sixer
Disliked
The Intermediate and Medium Term Delta counts indicate a further upmove too. Sixer {image}
Ignored
Dear Sixer,
the vertical green line at the right ,dated 11 Feb. 1:33 is an indication of an expected top ...?

If so then it is quite different from Jerry's suggestion for a top on Wedn. 8 Feb. 12:00 .
 
 
  • Post #7,770
  • Quote
  • Edited Feb 5, 2017 12:27am Feb 4, 2017 10:39pm | Edited Feb 5, 2017 12:27am
  •  Sixer
  • Joined Nov 2008 | Status: Member | 1,757 Posts
To your questions:

The dates are based on the Delta Graphics software:

https://www.deltasociety.com/content/one-day-time

but i use Miners Dymamic Trader platform to use intraday data.

ITD = Intermediate Term Delta (blue): 9 turning points plus inversions in 4 full moon months
MTD = Medium Term Delta (red): 8 turning points plus inversion in 1 year
LTD = Long Term Delta (black): 15 turning points in 4 years.
Valid for the EURUSD, other underlyings have different numbers.

The vertical line is the date of next full moon and has nothing to do with next high or low.

The intraday solution follows a 4 days calendar cycle with 12 turning points plus inversions and looks like the next chart.
See the calendar of February for the 4 days calendar cycle - the cycle starts at the orange line.

Sixer
Attached Image (click to enlarge)
Click to Enlarge

Name: D-EURUSD(5)-3.2.17.gif
Size: 37 KB
Attached Image
 
 
  • Post #7,771
  • Quote
  • Feb 5, 2017 11:00am Feb 5, 2017 11:00am
  •  F.g
  • Joined Aug 2016 | Status: Member | 6,962 Posts
Sixer , thank you for your answer . I understand the times are GMT +1 hour .

I got a bit confused by the second chart , the Calendar . How is it possible to have so many red dates in a month...?

Actually as many as blue... and every day is a significant reversal date... @@@ !!! I got something wrong !!!

Kindly help me
 
 
  • Post #7,772
  • Quote
  • Edited 4:57am Feb 6, 2017 12:04am | Edited 4:57am
  •  Sixer
  • Joined Nov 2008 | Status: Member | 1,757 Posts
It`s all about data. If you have a sufficient amount of Daily/Intraday data you can do an intensive testing to determine possible times of highs/lows for each time frame ...

A test of intraday turning points could be done for each "colour" seperately.
Today (blue) 4 turning points will occur: STD-9, STD-10, STD-11 and STD-12 (black numbers of the 5 min-chart in post #7770).

Sixer

Edit:
Test all january dates with "blue" colour - if you have the intraday data stored on your pc.
Attached Image
 
 
  • Post #7,773
  • Quote
  • Feb 6, 2017 5:04am Feb 6, 2017 5:04am
  •  Pipologist
  • Joined May 2009 | Status: testing/trading/testing/trading... | 1,799 Posts
Quoting jnevins
Disliked
Next week with more sub trades.... The swing in buy/sell was set to 2%. {image}
Ignored
What times are those shown on your charts? Is that US EST?
 
 
  • Post #7,774
  • Quote
  • Feb 6, 2017 3:39pm Feb 6, 2017 3:39pm
  •  F.g
  • Joined Aug 2016 | Status: Member | 6,962 Posts
Sixer , I don't understand anything..... STD-9 =???

It s not for me ...

Anyway thanks for responding
 
 
  • Post #7,775
  • Quote
  • Feb 6, 2017 10:32pm Feb 6, 2017 10:32pm
  •  jnevins
  • Joined Feb 2007 | Status: Member | 2,660 Posts
Quoting Pipologist
Disliked
{quote} What times are those shown on your charts? Is that US EST?
Ignored
Yes all times are EST and all data is 30 min EUR/USD....
 
 
  • Post #7,776
  • Quote
  • Edited 4:58am Feb 7, 2017 3:45am | Edited 4:58am
  •  Sixer
  • Joined Nov 2008 | Status: Member | 1,757 Posts
Jerry,

Miss Market will not "follow" your outlooks for this week ...
Is the Finance Mafia watching you ?

Sixer
Attached Image (click to enlarge)
Click to Enlarge

Name: EURUSD(30)-7.2.17.gif
Size: 26 KB
 
1
  • Post #7,777
  • Quote
  • Edited 10:06pm Feb 7, 2017 8:34pm | Edited 10:06pm
  •  jnevins
  • Joined Feb 2007 | Status: Member | 2,660 Posts
Quoting Sixer
Disliked
Jerry, Miss Market will not "follow" your outlooks for this week ... Is the Finance Mafia watching you ? Sixer {image}
Ignored
Part of me wants to say the week isn't over yet but the Earth Venus model certainly gave a misleading direction to the start of the week... Here is a Jupiter-Saturn model that I started exploring after reading Dr. Hans Hanula description of the JS synodic cycle. He describes how Gann's most important forecasting tool was the JS (20 year) cycle. "Jupiter was the bull of business and Saturn the bear"

I like that yellow and green sinuous trend indicator on your chart!

Here is the Jupiter - Saturn 32nd harmonic, heliocentric astronomy composite using a 50% fast orb with Auto Adjust RPO as the algorithm. The first shows the equity line growth and all the trades on 30 min EST data since mid April with 10,021 bars.

The 2nd chart shows this week using data up to the close last Friday. Sell at 12:57 on Feb 6 and buy on Wed. Feb 8th at 15:30 and hold until end of trading Friday.
Attached Image(s) (click to enlarge)
Click to Enlarge

Name: Capture.PNG
Size: 116 KB
Click to Enlarge

Name: Capture1.PNG
Size: 16 KB
 
 
  • Post #7,778
  • Quote
  • Feb 7, 2017 9:56pm Feb 7, 2017 9:56pm
  •  Sixer
  • Joined Nov 2008 | Status: Member | 1,757 Posts
The equity curve for the shown period is perfect - can you show any week from april last year how the weekly turning dates were meet ?

Sixer
 
 
  • Post #7,779
  • Quote
  • Feb 7, 2017 10:04pm Feb 7, 2017 10:04pm
  •  jnevins
  • Joined Feb 2007 | Status: Member | 2,660 Posts
Quoting Sixer
Disliked
The equity curve for the shown period is perfect - can you show any week from april last year how the weekly turning dates were meet ? Sixer
Ignored

Yes, I can zoom in to any week... let me know and I'll post that week or several weeks.
 
 
  • Post #7,780
  • Quote
  • Feb 7, 2017 11:19pm Feb 7, 2017 11:19pm
  •  peter941221
  • | Joined Dec 2016 | Status: Member | 14 Posts
Quoting jnevins
Disliked
{quote} Part of me wants to say the week isn't over yet but the Earth Venus model certainly gave a misleading direction to the start of the week... Here is a Jupiter-Saturn model that I started exploring after reading Dr. Hans Hanula description of the JS synodic cycle. He describes how Gann's most important forecasting tool was the JS (20 year) cycle. "Jupiter was the bull of business and Saturn the bear" I like that yellow and green sinuous trend indicator on your chart! Here is the Jupiter - Saturn 32nd harmonic, heliocentric astronomy composite...
Ignored
Hi jnevins,
Does the projection lines in the past recalculate to get the equity growth line, meaning they will rematch the prices in hindsight?
Thanks.
 
 
  • Interactive Trading
  • /
  • Planetary Cycles Trading (EUR/USD)
  • Reply to Thread
    • 1 387388Page 389390391 680
    • 1 Page 389 680
2 traders viewing now
  • More
Top of Page
  • Facebook
  • Twitter
About FF
  • Mission
  • Products
  • User Guide
  • Media Kit
  • Blog
  • Contact
FF Products
  • Forums
  • Trades
  • Calendar
  • News
  • Market
  • Brokers
  • Trade Explorer
FF Website
  • Homepage
  • Search
  • Members
  • Report a Bug
Follow FF
  • Facebook
  • Twitter

FF Sister Sites:

  • Metals Mine
  • Energy EXCH
  • Crypto Craft

Forex Factory® is a brand of Fair Economy, Inc.

Terms of Service / ©2023