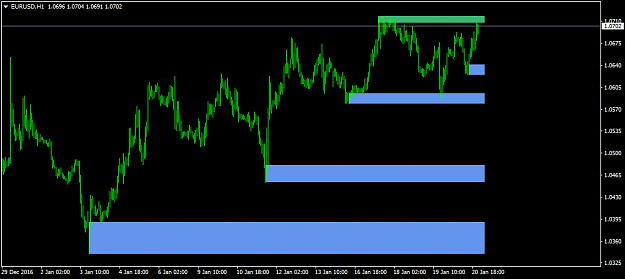
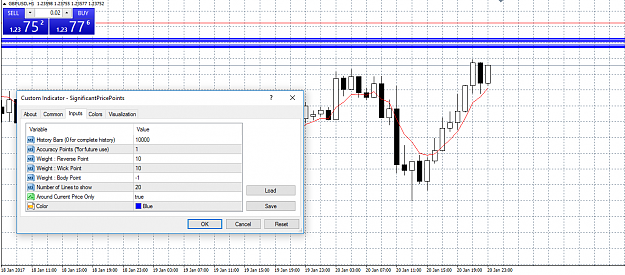
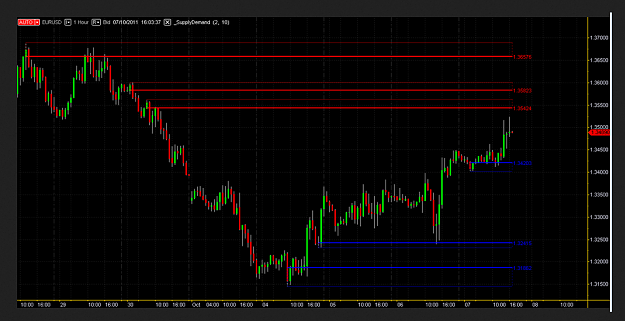
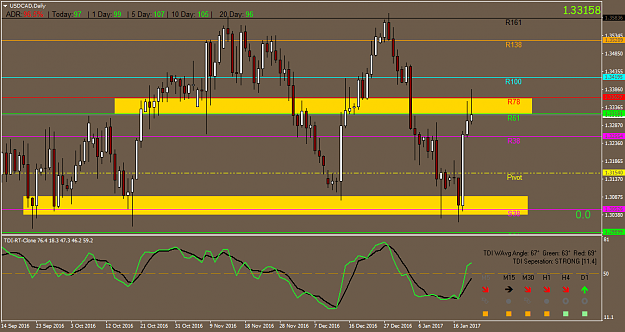
Disliked{quote} This is my first try using Nicholishen's idea ... Significant Price Points SPP_1.png;2130686 spp_2.png;2130688 spp_3.png;2130692 {file} {image} {image} {image}Ignored
I used the same Nicholishen's idea to build indicator similar to this, only with buffers . I did some experiments and statistics with weighting( cross and return = +1 ; tale = +1 ; cross , no return = -1) for first indicator and ( cross and return = +1 ; tale = +1 ; cross , no return = +0) for second indicator. First indicator was better for shore data could be separated in two parts 50:50 , where first half was mixed and second part - mostly win positions 2/1(win/loss) . For the second indicator determining zones was harder and results were in wider range and didn't concentrate in specific areas as it was more in first indicator. Data could be separated in two parts 30:60, where first part was mixed and second part mostly win positions, now 1:2 zone looks better but here is the thing , win/loss ratio dropped , now it was 1.42 : 1 , so the zone is less reliable. Also I would suggest tying input data with your indicator ( +10 ;+10;-10) just for experimenting and maybe (+10000;+100;+1) for the purpose if you want to know the exact number of crosses and returns, tales and simple crosses.
Thanks for this thread, it's great!
Know thyself