{quote} Hi Mosalem, Here is a video I just made on this week's projection line chart. It was late at night and I didn't want to disturb my wife too much so I am speaking a bit softly.... https://youtu.be/nWs7JlJQNuM
Ignored
For comparison, 3 highest cycles of the Spectrum module (red line) and the 4 highest cycles Q Spectrum (blue line)
There can be seen that better predicts.
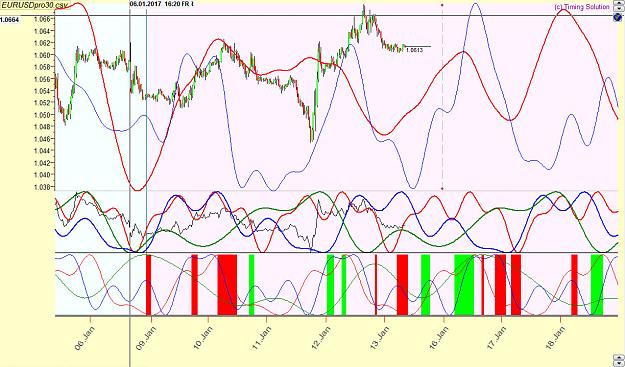
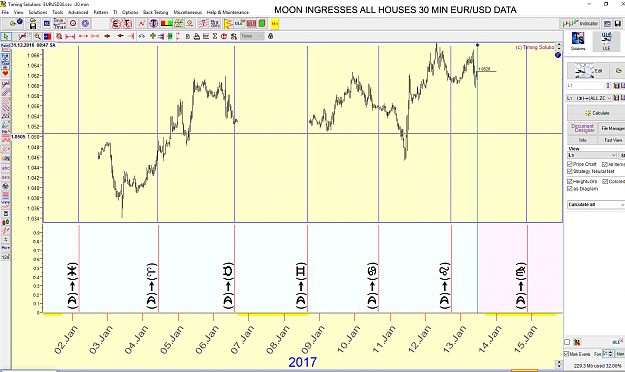
One more... even simpler... As the Moon enters just Aires, there is a 100% chance of 3 bars before the ingress being an up bar and 90% from the ingress point to 9 bars after being a down movement... case in point, On Jan 4, 2017 there was a Moon ingress into Aires at 10:33 am EST. In spite of all the projection lines pointing up, notice that the 9 bars following the ingress were down, then the up trend resumed. And 3 bars before the ingress there was an up bar. The low of that pin bar was 30 pips below the start of the 9 bar sequence. {image} {image}...
Ignored
Jerry, re. the Moon crossing 0* [A Line] I have to add the following... The exact moment was 11:20 . It marked a top at 1.04 87 then 2 hours later exiting A Line [1*] price was at 1.04 68 a drop of a mere ...19 pips . Then a new high at 1.05 00 , then an erratic drop to 1.04 52 and then continuation upwards for 1.06 15 I have been studying for a long time what happens when mOON CROSSES A Line and especially 0* longitude. Sometimes there are some jewels and quite often...plain stones . . . . Expecting something serious to happen and ...NOT happening is costly and dissapointing. A very usual phainomenon in this hobby...
{quote} For comparison, 3 highest cycles of the Spectrum module (red line) and the 4 highest cycles Q Spectrum (blue line) There can be seen that better predicts. {image}
Ignored
MIT777, Thanks for posting! I will look at that combination.
{quote} Jerry, re. the Moon crossing 0* [A Line] I have to add the following... The exact moment was 11:20 . It marked a top at 1.04 87 then 2 hours later exiting A Line [1*] price was at 1.04 68 a drop of a mere ...19 pips . Then a new high at 1.05 00 , then an erratic drop to 1.04 52 and then continuation upwards for 1.06 15 I have been studying for a long time what happens when mOON CROSSES A Line and especially 0* longitude. Sometimes there are some jewels and quite often...plain stones . . . . Expecting something serious to happen and ...NOT...
Ignored
Thanks F.g... Yes, being "sure" about anything in this business will lead to disaster... My data is based on only 10,000 bars or about 10 moon cycles around the houses. It does bear looking at though. The moon entering Aires has missed the market a few times recently, 31 Dec, after the market closed on Friday, Saturday 12, Dec a miss, Sunday, 6 Nov. a miss, and the last good hit was 10 October a Monday ... Going back to April 1st, there was a miss on Friday after market closed... So I was working with 7 hits/samples... I just ran an efficiency test for the Moon entering each house, one at a time, in turn and will put that together into a pdf.
Hi Jerry, thanks for your 7614 post, it was great, I am really interested in the step before all of this and how you came about finding these particular set of settings for the Euro? Was it just trial and error over a long period or can you upload a video and show me step by step how you found these exact parameters for forecasting on the Euro, I would like to try other instruments for forecasting and I know that every instrument has its own vibration so what works for the Euro will likely not work for anything else, so if you can show me in TS how you originally arrived at using these particular set of astro events that would be great.
Regards John,Perth.
Anybody can provide his/her experience in using the JSatl-Indicator for "Smoothing" together with other instruments? https://www.mql5.com/en/code/16144 I didn`t find a version for MT4. Sixer
{quote} Hi Mosalem, Here is a video I just made on this week's projection line chart. It was late at night and I didn't want to disturb my wife too much so I am speaking a bit softly.... https://youtu.be/nWs7JlJQNuM
Ignored
Thanks a lot Jnevins for the great video with the comprehensive and details steps. I have tried to reproduce with the demo version for venus but it seems I am not getting the same results due to whether I am not correctly importing the price data as the MT4 server is EST +7 and not sure what to set and it shows a lot of gapping during the weekends. I have tried on daily data using moon geo position and H1, and 100 smooth but the comparison to the actual price is not promising. I suspect it is how to make the right setup.
Not sure what the parameters would imply or mean. for example, venus -venus helio is venus position around the sun not the earth (geo). the cycle is around 79 days or so...
harmonics and how it impact results, algorithm to be used, the smooth of the orbit, and what would be a good reference to start experimentation ?
however, great videos and discussion indeed. thanks a lot Jnevins
Hi Jerry, thanks for your 7614 post, it was great, I am really interested in the step before all of this and how you came about finding these particular set of settings for the Euro? Was it just trial and error over a long period or can you upload a video and show me step by step how you found these exact parameters for forecasting on the Euro, I would like to try other instruments for forecasting and I know that every instrument has its own vibration so what works for the Euro will likely not work for anything else, so if you can show me in TS...
Ignored
Hi John,
Thanks for stopping in! I hope you become a regular here.... Yes, I found these setting by trial and error... I look at the curves, move the LBC back and forth. As you said, each instrument has its own vibration and the only solution is "screen time" to discover what might be working for it... The time frame is very important as well as how many bars loaded into TS. I'll work up a video on how I arrive at my projection lines this week-end.
{quote} Thanks a lot Jnevins for the great video with the comprehensive and details steps. I have tried to reproduce with the demo version for venus but it seems I am not getting the same results due to whether I am not correctly importing the price data as the MT4 server is EST +7 and not sure what to set and it shows a lot of gapping during the weekends. I have tried on daily data using moon geo position and H1, and 100 smooth but the comparison to the actual price is not promising. I suspect it is how to make the right setup. Not sure what the...
Ignored
There are many variables... 1. how many bars are you loading into TS? I have my Oanda MT4 set up to export 10,000 bars, no matter the time frame. 2. Venus-Venus helio is the movement of Venus around the Sun not the Earth. I adjust the harmonic box to make the best possible curve on the week just finished in order to settle on a projection line for the upcoming week. I ignore the week-ends and have "Time" not "Bars" chosen in the drop down along the top of the chart... that creates an intentional gap for the week-end. Play with the harmonic and the orb smoothing to arrive at the best possible curve on the past data, especially the previous week. Dig in and start playing. Here is a good place to begin with a series of structured lessons... http://www.timingsolution.com/TS/Study/
{quote} Hi Jnevins, great effort on your way of trading. Could you please share which forecast you have used to achieve the results you posted on Post 7,630 Thanks.
Ignored
Hi Way2Freedom,
I post a predictive chart before the trading for the week begins... then follow up after the close for the week with an MT4 chart marked up with the signals form the predictive chart.... In this case, start with post 7586 and a mid week-update on post 7603.
{quote} Hi Way2Freedom, I post a predictive chart before the trading for the week begins... then follow up after the close for the week with an MT4 chart marked up with the signals form the predictive chart.... In this case, start with post 7586 and a mid week-update on post 7603. Good luck... JNevins
Ignored
Thanks for the explanation.
Do you trade those entries yourself even in a demo account?
Looking into next week... I see a cluster of very important signatures that will create an extremety in the markets.
Wedn. 18 /1
Mars 150* Jup. and K. -2:52
Merc. sq. PL HELIO -3:54
Merc. trine Venus HELIO -11:51
Thu. 19 /1
MARS sq. SAT. -4:17
Jup //- Ouranus [contra] -8:09
Merc. // Sat. - 8:14
Venus 144* Jup. - 8:55 and max W. Elongation of Mercury...
Venus opp. Sat. HELIO -13:08
Sun 300* - 16:23
Fri. 20/1
Merc. opp. Ouranus HELIO -0:04
Est. always...
Take care , don't be lost...
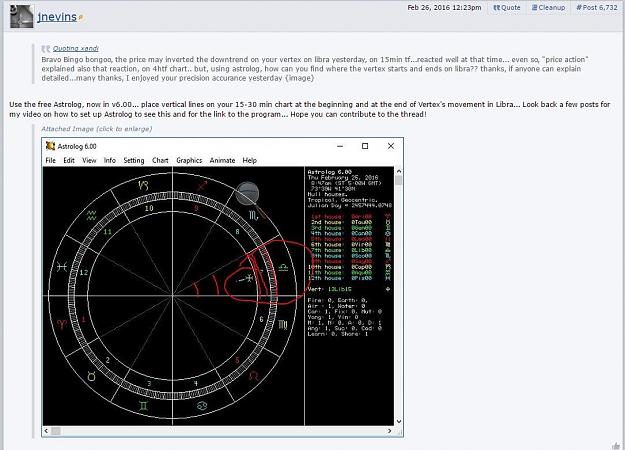
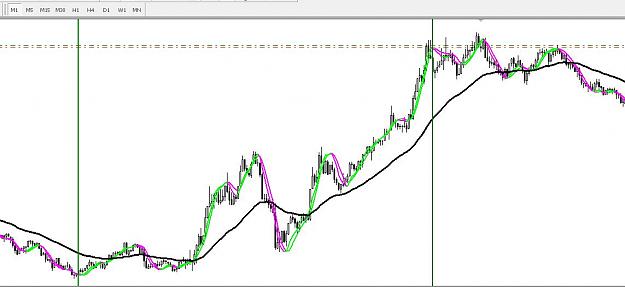
Back in February I posted an Astrolog chart noticing nice movement while Vertex.... So I randomly went to Wednesday of this week to see what happened when Vertex is in Libra... Chart 2.... +150 pips. Beginning of ingress is 1st green line, egress is second green line...