• Home
  • Forums
  • Trades
  • News
  • Calendar
  • Market
  • Brokers
  • Login
  • Join
  • User/Email: Password:
  • 10:30am
Menu
  • Forums
  • Trades
  • News
  • Calendar
  • Market
  • Brokers
  • Login
  • Join
  • 10:30am
Sister Sites
  • Metals Mine
  • Energy EXCH
  • Crypto Craft

Options

Bookmark Thread

First Page First Unread Last Page Last Post

Print Thread

Similar Threads

Successful Trading & Determining the Probability of a Trading System 10 replies

Pivot Point Squeeze, high probability system 778 replies

My Low Risk Hig Probability Trading System with aggressive MM 6 replies

Probability System Theory and Money Management 58 replies

High probability Trading System 2 replies

  • Trading Systems
  • /
  • Reply to Thread
  • Subscribe
  • 4
Attachments: Essay: Trading system probability
Exit Attachments
Tags: Essay: Trading system probability
Cancel

Essay: Trading system probability

  • Last Post
  •  
  • Page 1 2
  • Page 1 2
  •  
  • Post #1
  • Quote
  • First Post: Edited 2:05am Sep 1, 2006 1:54am | Edited 2:05am
  •  silverpike
  • | Joined Jun 2006 | Status: Member | 39 Posts
This is intended to be a guide for traders looking at existing trading systems, or traders wanting to evaluate their own trading systems. I hope you find this valuable. I have used this information for the last 2 years, and I have found it tremendously useful.<o></o>

A Need for System Statistics<o></o>

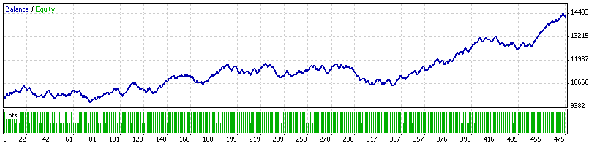
When talking about trading systems, there exists a fundamental need to represent their performance in a way that is comparable. A trader must be able to evaluate a trading system to determine if this system (a) produces acceptable returns and (b) has an acceptable risk threshold. It is possible to have a wildly profitable trading system, but puts 100% of the capital at risk. Luckily for us, there are some very useful statistical formulae which can sum this information up nicely for us. These formulae are flexible enough to be able to compare 2 trading systems with very different characteristics, so we can make an informed decision regarding the two. In this essay, I will walk us through an analysis of the Firebird EA, because it has been very popular recently. In this example, I will focus on the EUR/USD pair, because this EA uses different settings for different currencies.<o></o> Basic profitability is the first attribute we will discuss.<o></o>

Risk and Reward<o></o>

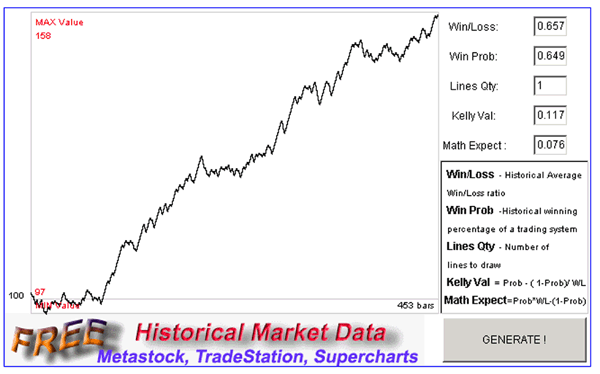
The first 2 ingredients to computing expected return is to evaluate risk and reward. To put this most simply, reward is the average magnitude of the win, and risk is the average magnitude of the loss. The rate of these events will be discussed separately. These usually correspond to the take profit (t/p) and stop loss (s/l) of each trade. If the t/p and s/l are different for each trade, then the t/p values must be averaged over all completed trades (the same is done for stop losses). Some automated Expert Advisors (EAs) in MT4 have fixed t/p and s/l levels coded in, so these values may be easy to find. It is useful to look at these two values as a ratio; the risk/reward ratio. Trading systems with low risk/reward ratios aren't bad per se, they just require some special attention (later in the next section). It should also be apparent that the greater number of trades used to calculate these averages, the more accurate the averages will be. Having only 3 or 4 trades using a system will not give very representative numbers, so every attempt should be made to either make or simulate more trades. For systems which can be backtested, either in MT4 or elsewhere, average values calculated as above will give us what we want, if the t/p and s/l values are not constant in the system.<o></o><o></o>

Calculating risk/reward for Firebird is easy. There is a fixed t/p level of 22, and a s/l of 220. Risk/reward is 10/1, and is worthy of comment. On the face of it, this appears a very low number. Could a system with this risk/reward ratio be profitable? The next analyses will tell us for sure.<o></o>

<o> </o>
  • Post #2
  • Quote
  • Edited 2:10am Sep 1, 2006 1:55am | Edited 2:10am
  •  silverpike
  • | Joined Jun 2006 | Status: Member | 39 Posts
Expectation <o></o>

Once we have the risk/reward ratio, we can find a very important number: the expectation of the system. A system has positive expectancy if, over a certain timeframe, it produces a growth in capital. Likewise, a system has negative expectancy if the trading system will lose money over time. Naturally, we want to use the system with the highest expectancy. Later, we will learn about another danger which can occur with having high expectancy (which can occur with negative expectancy too, but makes for a very lousy system). So the obvious question is: how is this calculated?<o></o>

The short answer is that this value is best calculated by running a little simulation called a monte-carlo simulation. Despite the funny name, this type of calculation is used in my physical, statistical, and biological processes. The easiest way to do this is to use a neat Java tool available online here<o></o>

You will notice that we now also include the win/loss ratio in the calculation. I think most traders intuitively find this number, because it is an obvious indication of a trading system's performance. This is an important number we need, in addition to our win/loss ratio. This applet will also tell you the optimum trade size based on your system's parameters, which we will discuss briefly (below). The graph of this program will tell you how your capital is likely to appreciate, as well as the specific expectancy number.<o></o>

For our Firebird EA, let's use the Java calculator to find out. With this tool we do not need to know beforehand what our position size must be, because the tool will generate an optimum size based on the R/R and the success rate. However, we will need to find the success (win) rate. When I backtested this EA over a 12-month timeframe with an M15 period, I had a win rate of 93%. Using our calculator with a win/loss ratio of 0.1, and a success rate of 0.9, we find something interesting: the system is not profitable over time. With a success rate of 0.93, the system is marginally profitable.<o></o>

Position Size <o></o>

The next thing which should be apparent is that the magnitude of these wins or losses are also a function of the trade size. This is where money management comes into play. Please note that this essay does not deal explicitly with position sizing. There are many theories about how do size trades, and there was a recent thread on the subject. These calculations should be made with a specific notion of how much money to risk for each trade, as well as the t/p and s/l levels. Combined, we can determine how much of our capital can be increased or decreased with each particular trade. For trading systems which vary the trade size based on market factors, it gets more complicated. In that case, an average position size must be computed, and used in conjunction with the average t/p and s/l values. When designing a system, it would be wise to use the expectancy to determine an optimum size, just like the Java calculator does.<o></o>

Back to our Firebird EA: The EA trades 0.1 lot per trade, which equates to $1 per pip. This is a low risk level, assuming a default starting capital of $10k. The EA functions this way because it opens many trades simultaneously, and lets them run until either the t/p or s/l is hit. On the face of it, it is easy to be amazed at the 90%+ success rate of this system. It may lead us to believe it is an excellent trading system. Calculating the Sharpe Ratio, explained below, tells us for certain.<o></o>
 
 
  • Post #3
  • Quote
  • Edited 2:14am Sep 1, 2006 1:56am | Edited 2:14am
  •  silverpike
  • | Joined Jun 2006 | Status: Member | 39 Posts
Sharpe Ratio<o></o>

Now that we have found our expectancy, there is another risk to quantify: how much of our capital do we risk losing in order to let our system run it's way? This is a very important question, especially since losing several trades in a row, or losing a large trade has a psychological impact on the trader. In order to represent this, we should introduce a measurement of risk. One of the most widely accepted ways to measure this is the Sharpe Ratio. The Sharpe Ratio is a clever formula designed to take into account volatility in the trading results. A trading system which has big wins and big losses has large volatility. Granted, big wins are great, but big losses are not. Therefore, the Sharpe Ratio penalizes results which have large skews in trading results. It can be calculated by viewing the formula in the link above.<o></o>

Systems which have high Sharpe Ratios are very desirable, because not only are they profitable, but they are consistently so. An Sharpe Ratio above 0 is profitable (positive expectancy). An Sharpe Ratio above 1 is fair. An Sharpe Ratio above 2.0 is considered good, and anything above 3.0 is considered great. It is interesting to note that most commercial hedge funds have Sharpe Ratios less than 1.0. Most aggressive independent traders can do better than 2.0.<o></o>

The Sharpe Ratio is an excellent number to use when comparing trading systems. In can be used in place of the expectancy value, because it essentially captures that information, plus gives us additional insight into volatility. In many cases, I can learn all I really need to about a trading system based on it's Sharpe Ratio; it's a very powerful number.<o></o>

Calculating the Sharpe <o></o>

To calculate the Sharpe Ratio for Firebird, we need to do a little extra math. First, we will determine the numerator. We need to find 2 numbers, the expected return, and the risk-free rate. The risk-free rate is 0.05 per year(currently 5% based on the US Federal Reserve rate), it must be adjusted to the appropriate per-trade timeframe, to determine the value of the numerator in the Sharpe Ratio. Assuming 5 trades are closed per day on average, this number becomes very small, and can be approximated as zero. The expected rate is equivalent to the expectancy value that our Java calculator returns, because we are computing this on a per-trade basis. These two values give us the numerator of our ratio.<o></o>

The denominator can be found by the standard deviation. This value is a more complicated number to find, but it’s doable using normal tools. The easiest way to find it is to run a backtest simulation in MT4. When the sim is done, save the results as an .html file. Then using Excel, use the file filter to open the .html file. In Excel, use the STDDEV() built in function on the column containing the win/loss amounts (in $). However, this value needs to be the standard deviation of the percent return, so we need to do one more tweak. We can make a new column of data which represents returns in percent, which is the dollar-returns divided by the starting capital. The STDDEV() function will then give us the value we are looking for. I have attached my Excel file for other to look at.<o></o>

I calculated the volatility using my MT4 trade history in Excel, and found the final Sharpe Ratio:<o></o>

It is outstanding, approximately 5.15. 5.15 is an outstanding number for a trading system. However, it is very important to illustrate something: this number is almost entirely dependant on the actual win rate percentage. If the win percentage ever drops below 90%, this system will lose money with the same speed it succeeds (with a high rate).<o></o>

Conclusion <o></o>

This article was intended to shine some light on ways to evaluate and compare different trading systems. We studied the expectancy and Sharpe Ratio of the Firebird EA, and discovered that despite it’s low risk/return ratio, it has an outstanding Sharpe Ratio. This EA is a prime example of how useful the Sharpe Ratio can be, when used as a tool to learn from powerful trading systems.<o></o>
Attached File(s)
File Type: zip firebirdEA.zip   36 KB | 1,036 downloads
 
 
  • Post #4
  • Quote
  • Sep 1, 2006 4:25am Sep 1, 2006 4:25am
  •  silverpike
  • | Joined Jun 2006 | Status: Member | 39 Posts
One thing I wanted to add:

A thank you goes out to Darkstar for proofing my 1st draft of this essay, and contributing some good ideas to its structure.
 
 
  • Post #5
  • Quote
  • Sep 1, 2006 5:44am Sep 1, 2006 5:44am
  •  Jarret
  • | Joined Jul 2006 | Status: Member | 142 Posts
This is a great post, thanks for the effort. I hope it is widely read!

Best of trading to you friend.
 
 
  • Post #6
  • Quote
  • Sep 1, 2006 7:48am Sep 1, 2006 7:48am
  •  Puppy
  • | Joined Nov 2005 | Status: EA trader | 146 Posts
Thanks silverpike,

A very good analysis
 
 
  • Post #7
  • Quote
  • Sep 1, 2006 12:55pm Sep 1, 2006 12:55pm
  •  TraderSeven
  • | Joined Jul 2006 | Status: Opulentia est licentia | 107 Posts
Quoting philmcgrew
Disliked

PS Many funds have switched to a modified sharpe ratio.
Ignored
Is that the Sortino ratio?
The ratio that only measures downward volatility.
I think it has some good point measuring downward volatility because that's the harmful part. But Sharpe is much wider accepted discussed.
May the pips be with you.
 
 
  • Post #8
  • Quote
  • Sep 1, 2006 1:24pm Sep 1, 2006 1:24pm
  •  TraderSeven
  • | Joined Jul 2006 | Status: Opulentia est licentia | 107 Posts
Thanks a lot for this post silverpike.
I'm really amazed about the Sharpe ratio. The P/L is more in line with what I expected (for this version)

One question:
Quote
Disliked
I have used this information for the last 2 years, and I have found it tremendously useful
How can that be for a EA/version that doesn't exist that long?
May the pips be with you.
 
 
  • Post #9
  • Quote
  • Sep 1, 2006 2:08pm Sep 1, 2006 2:08pm
  •  silverpike
  • | Joined Jun 2006 | Status: Member | 39 Posts
Quoting TraderSeven
Disliked
One question:

How can that be for a EA/version that doesn't exist that long?
Ignored
I got a chuckle out of this.

The purpose of this essay is to discuss expectancy and the Sharpe Ratio, not Firebird. Firebird was just an example.
 
 
  • Post #10
  • Quote
  • Sep 1, 2006 2:19pm Sep 1, 2006 2:19pm
  •  Bemac
  • Joined Jan 2006 | Status: Monarch o' the Glen | 5,561 Posts
Quoting TraderSeven
Disliked

How can that be for a EA/version that doesn't exist that long?
Ignored
Maybe it's a "Version" issue but BigBaller started the FBird thread in April.
 
 
  • Post #11
  • Quote
  • Edited 3:16pm Sep 1, 2006 2:47pm | Edited 3:16pm
  •  silverpike
  • | Joined Jun 2006 | Status: Member | 39 Posts
There is one really important point that I need to make, preferably on the first page so people will read it.

This thread is not an endorsement of the Firebird EA. I merely use it as an interesting example. I don't trade this EA at all.

The problem with my study is that it starts after the major price shift in May of this year. In ranging markets, this EA does great. Everytime there's a major market shift, this EA gets brutalized. You can see this for yourself by running a backtest which includes a 700+ point shift in the market. I now regret that I didn't do that, because I believe I am painting a flawed picture of Firebird. I highly reccomend you see this for yourself, before Firebird burns your bed.

I would never run this EA for that reason. Especially because I believe there's another major market shift coming in the next few months. I believe that if I ran this backtest from February, the win rate would be well below 90%.

If you want to discuss major market moves or the Firebird EA, I please ask you don't use this thread to do so. I would like to keep this thread only about probability and trading, for those that are searching, or only interested in reading trading articles.
 
 
  • Post #12
  • Quote
  • Sep 1, 2006 2:49pm Sep 1, 2006 2:49pm
  •  silverpike
  • | Joined Jun 2006 | Status: Member | 39 Posts
Placeholder 2
(to be filled in tonight)
 
 
  • Post #13
  • Quote
  • Sep 1, 2006 4:39pm Sep 1, 2006 4:39pm
  •  TraderSeven
  • | Joined Jul 2006 | Status: Opulentia est licentia | 107 Posts
Quoting silverpike
Disliked
I got a chuckle out of this.

The purpose of this essay is to discuss expectancy and the Sharpe Ratio, not Firebird. Firebird was just an example.
Ignored
Ha, you refereing to Sharpe and expectancy.
That makes things much clearer.
I got confused because it ws mentioned, enclosed and link to a thread ws posted.

Got some essay about Sortino, Omega, MAR, Treynor, etc ?
I'm using this kind of stuff longer than 2 years
May the pips be with you.
 
 
  • Post #14
  • Quote
  • Sep 4, 2006 6:15am Sep 4, 2006 6:15am
  •  silverpike
  • | Joined Jun 2006 | Status: Member | 39 Posts
How bizzarre; I can't edit my previous posts anymore.

I wanted to add one more bit of info to this thread. One other popular measurement of performance is the Sortino Ratio. Sortino is much like the Sharpe, except the variance is calculated using only the negative returns. This will not penalize any trading system with large positive increases, just the negatives.

There was a good discussion of this on Oanda's board a while back, by none other than Chaffcombe. Chaff has an excellent personal site, with some very good trading info on it.
 
 
  • Post #15
  • Quote
  • Sep 26, 2006 11:30am Sep 26, 2006 11:30am
  •  aparsai
  • Joined Mar 2006 | Status: Member | 1,120 Posts
Quoting silverpike
Disliked
Expectation <?xml:namespace prefix = o /><o></o>
....The short answer is that this value is best calculated by running a little simulation called a monte-carlo simulation. Despite the funny name, this type of calculation is used in my physical, statistical, and biological processes. The easiest way to do this is to use a neat Java tool available online here<o></o>
....<o></o>
Ignored
Thanks for your excellent essay. I've got a question about the monte-carlo simulation.

I'm currently working on an EA which uses a rather complicated approach to calculate s/l and t/p for every trade. It also uses a trailing stop to enhance the behaviour of the system. I tested the EA over a two year period and it generated the following results:
_______________________________________________________________________

<TABLE cellSpacing=1 cellPadding=3 width=820 border=0><TBODY><TR align=left><TD colSpan=2>Symbol</TD><TD colSpan=4>GBPUSD (Great British Pound vs US Dollar)</TD></TR><TR align=left><TD colSpan=2>Period</TD><TD colSpan=4>15 Minutes (M15) 2004.09.20 00:00 - 2006.09.20 00:00 (2004.09.20 - 2006.09.20)</TD></TR><TR align=left><TD colSpan=2>Model</TD><TD colSpan=4>Every tick (based on all available least timeframes with fractal interpolation of every tick)</TD></TR><TR align=left><TD colSpan=2></TD><TD colSpan=4></TD></TR><TR align=left><TD colSpan=2><TR align=left><TD>Bars in test</TD><TD align=right>56145</TD><TD>Ticks modelled</TD><TD align=right>2829586</TD><TD>Modelling quality</TD><TD align=right>90.00%</TD></TR><TR height=8><TD colSpan=6></TD></TR><TR align=left><TD>Initial deposit</TD><TD align=right>10000.00</TD><TD></TD><TD align=right></TD><TD></TD><TD align=right></TD></TR><TR align=left><TD>Total net profit</TD><TD align=right>4275.12</TD><TD>Gross profit</TD><TD align=right>23726.38</TD><TD>Gross loss</TD><TD align=right>-19451.26</TD></TR><TR align=left><TD>Profit factor</TD><TD align=right>1.22</TD><TD>Expected payoff</TD><TD align=right>9.02</TD><TD></TD><TD align=right></TD></TR><TR align=left><TD>Absolute drawdown</TD><TD align=right>373.23</TD><TD>Maximal drawdown</TD><TD align=right>1244.35 (10.54%)</TD><TD>Relative drawdown</TD><TD align=right>10.54% (1244.35)</TD></TR><TR height=8><TD colSpan=6></TD></TR><TR align=left><TD>Total trades</TD><TD align=right>474</TD><TD>Short positions (won %)</TD><TD align=right>243 (63.37%)</TD><TD>Long positions (won %)</TD><TD align=right>231 (66.67%)</TD></TR><TR align=left><TD align=right colSpan=2></TD><TD>Profit trades (% of total)</TD><TD align=right>308 (64.98%)</TD><TD>Loss trades (% of total)</TD><TD align=right>166 (35.02%)</TD></TR><TR align=left><TD align=right colSpan=2>Largest</TD><TD>profit trade</TD><TD align=right>147.26</TD><TD>loss trade</TD><TD align=right>-154.50</TD></TR><TR align=left><TD align=right colSpan=2>Average</TD><TD>profit trade</TD><TD align=right>77.03</TD><TD>loss trade</TD><TD align=right>-117.18</TD></TR><TR align=left><TD align=right colSpan=2>Maximum</TD><TD>consecutive wins (profit in money)</TD><TD align=right>14 (1246.12)</TD><TD>consecutive losses (loss in money)</TD><TD align=right>5 (-497.06)</TD></TR><TR align=left><TD align=right colSpan=2>Maximal</TD><TD>consecutive profit (count of wins)</TD><TD align=right>1246.12 (14)</TD><TD>consecutive loss (count of losses)</TD><TD align=right>-508.38 (4)</TD></TR><TR align=left><TD align=right colSpan=2>Average</TD><TD>consecutive wins</TD><TD align=right>3</TD><TD>consecutive losses</TD><TD align=right>2</TD></TR></TBODY></TABLE>
_______________________________________________________________

Since calculating Risk/Reward ration through sl/tp is not possible I used the average profit trade per average loss trade to calculate win/loss ratio (i.e. 77.03/117.18=0.6573). I also used profit trades percentage for Win Prob. Is it a correct approach? Can we consider this EA a winner? I've attached the image that I got from backtesting and also the monte-carlo simulator's result.

BTW, for the purpose of this EA I've set the VAR (Value At Risk) to 1% for every trade.

Thanks
Attached Images
 
 
  • Post #16
  • Quote
  • Sep 26, 2006 6:22pm Sep 26, 2006 6:22pm
  •  silverpike
  • | Joined Jun 2006 | Status: Member | 39 Posts
Quoting aparsai
Disliked
Thanks for your excellent essay. I've got a question about the monte-carlo simulation.
Ignored
Thank you. I'm very glad it was useful to you.

Quote
Disliked
Since calculating Risk/Reward ration through sl/tp is not possible I used the average profit trade per average loss trade to calculate win/loss ratio (i.e. 77.03/117.18=0.6573). I also used profit trades percentage for Win Prob. Is it a correct approach? Can we consider this EA a winner? I've attached the image that I got from backtesting and also the monte-carlo simulator's result.
This is a really great example. When I first wrote the essay, I was thinking of including an EA example which didn't have a fixed S/L and T/P level. For simplicity I stuck with Firebird.

Your calculations are correct as shown. I get the same simulation results as you do (although the graph is random, due to the nature of a monte-carlo sim). The expectancy of this EA is 0.0769, which means it will be profitable over the long term. It is still below 0.1, which means I would also be looking for alternatives, because I have seen systems than can do better. If you want to use my Excel sheet, you should be able to calculate the Sharpe Ratio also.
 
 
  • Post #17
  • Quote
  • Sep 26, 2006 7:04pm Sep 26, 2006 7:04pm
  •  quathar
  • | Joined Sep 2006 | Status: Member | 31 Posts
As said already, great article.
I was wondering about the kelly formula - I need to read up on it - but does it take volatility into account? The monte carlo simulation doesn't seem to.
 
 
  • Post #18
  • Quote
  • Sep 26, 2006 7:55pm Sep 26, 2006 7:55pm
  •  twinchell
  • | Joined Apr 2006 | Status: Ousted Member | 540 Posts
Amazing information, thanks for pointing this out quathar. Question for silverpike: can you explain the expectancy value a bit more. I'm looking for more of what does a "X" value represent. For example, one of my EAs has an expectancy of 0.175. This means it is profitable, but how profitable? Is there a certain threshold from your experience that jumps out as a very nice system? Great essay once again!
 
 
  • Post #19
  • Quote
  • Sep 27, 2006 2:38am Sep 27, 2006 2:38am
  •  silverpike
  • | Joined Jun 2006 | Status: Member | 39 Posts
Quoting quathar
Disliked
As said already, great article.
I was wondering about the kelly formula - I need to read up on it - but does it take volatility into account? The monte carlo simulation doesn't seem to.
Ignored
No, it doesn't. The Kelly value is a formula-derived number, and it tells the trader what percentage of the total capital to risk on each trade. This number is determined from the risk/reward and win rates.

Choosing percentages less than this value will work, but the system will not make money as fast as it could (in theory). Using percentages larger than this means the trader may end up in ruin (total loss of capital). The Kelly value is chosen to minimize a certain "risk of ruin". I don't know offhand what criteria the online calculator uses, but it's probably appropriate.
 
 
  • Post #20
  • Quote
  • Sep 27, 2006 2:40am Sep 27, 2006 2:40am
  •  silverpike
  • | Joined Jun 2006 | Status: Member | 39 Posts
Quoting twinchell
Disliked
Amazing information, thanks for pointing this out quathar. Question for silverpike: can you explain the expectancy value a bit more. I'm looking for more of what does a "X" value represent. For example, one of my EAs has an expectancy of 0.175. This means it is profitable, but how profitable? Is there a certain threshold from your experience that jumps out as a very nice system? Great essay once again!
Ignored
Expectancy, as far as I know, has no specific meaning. They can be used for relative comparison. Values greater than zero will have positive returns, and negative values means it's a loser. Nothing beyond that.
 
 
  • Trading Systems
  • /
  • Essay: Trading system probability
  • Reply to Thread
    • Page 1 2
    • Page 1 2
0 traders viewing now
  • More
Top of Page
  • Facebook
  • Twitter
About FF
  • Mission
  • Products
  • User Guide
  • Media Kit
  • Blog
  • Contact
FF Products
  • Forums
  • Trades
  • Calendar
  • News
  • Market
  • Brokers
  • Trade Explorer
FF Website
  • Homepage
  • Search
  • Members
  • Report a Bug
Follow FF
  • Facebook
  • Twitter

FF Sister Sites:

  • Metals Mine
  • Energy EXCH
  • Crypto Craft

Forex Factory® is a brand of Fair Economy, Inc.

Terms of Service / ©2023