I expected much more strength today... but we have to settle with reality and not our expectations........ The NFP numbers , which I don't see ,seem to be dissapointing... Shorted lightly and waiting 13:58 to short more . SL today's highs.
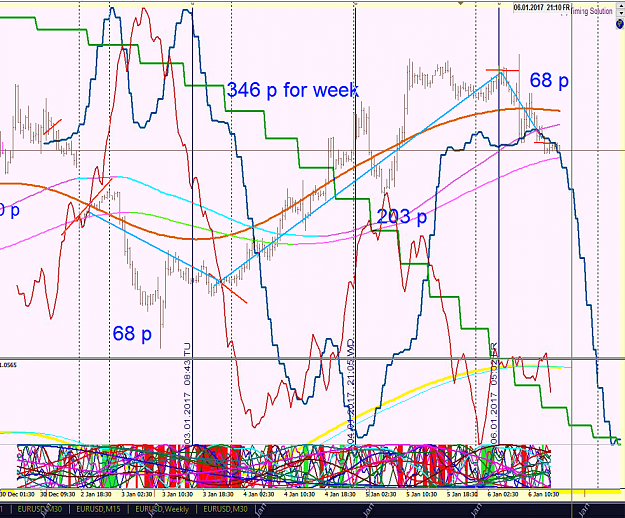
As traded results for the week of Jan 3-6... Please refer to post 7548 referring to the Q Spectrum and Venus... the overall Q Spectrum saved the day... My first chart posted with a Uranus down trend threw me off at first ... so please disregard that green curve....
I overlaid the mt4 chart for the week with the chart in post 7548 to see and make connections to real price action as it unfolded.... a bit messy but somewhat useful nevertheless....
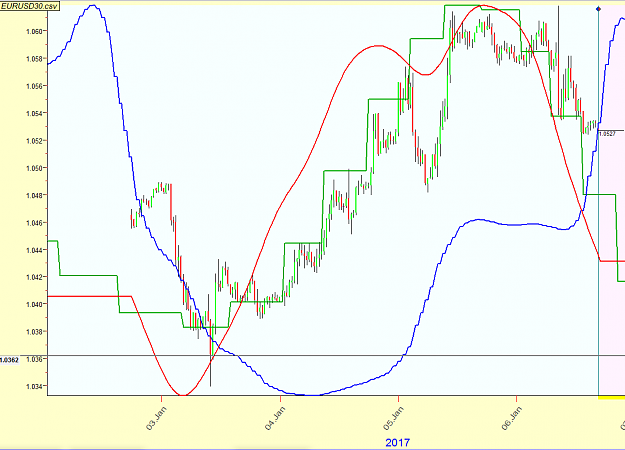
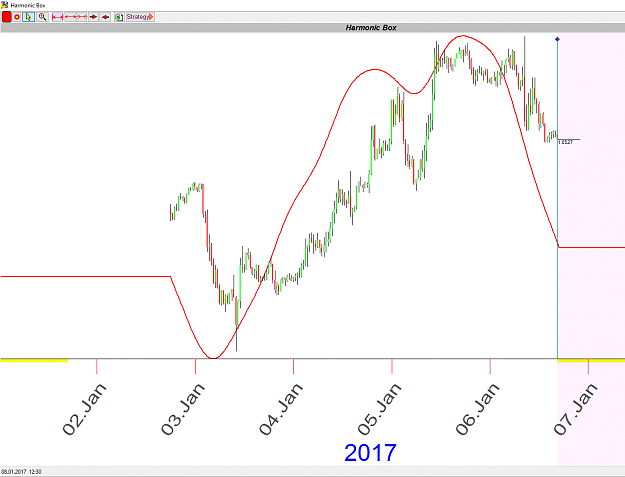
Looks like another up week overall... I am trying an overlay (red line) of an older TS module I found in the older Spectrum analyzer called Harmonic Box.... Buy and Sell points are marked on the chart. Close any open orders at 11:36 am on Friday or trade the last few hours of the session using regular TA.... the afternoon session on Friday is usually too hard to predict. Again for demo or entertainment. This is an ongoing experiment.
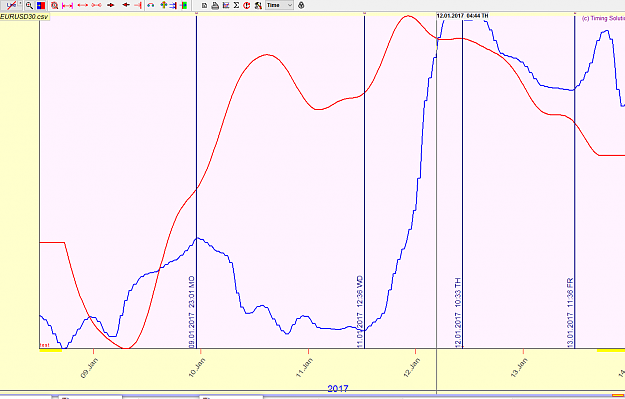
The second chart shows the harmonic Box overlaid on last week's price action... I'll be interested to see if there is follow through on a prediction basis for this module.
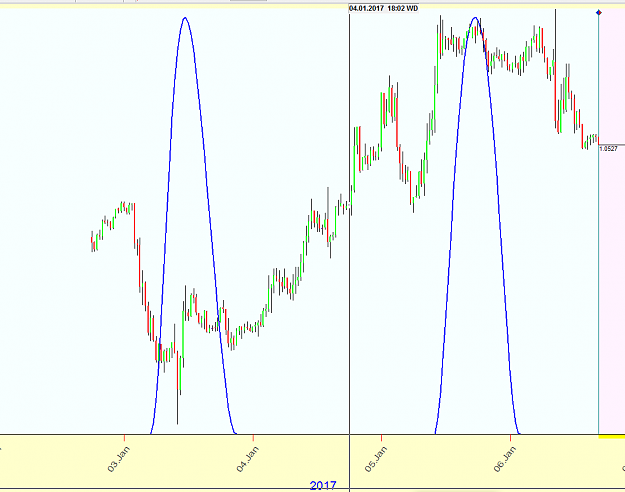
The Blue line was calculated with the astronomy module using Venus-Venus, Heliocentric, 3rd harmonic, Synodic algorithm and smooth orb of 10%
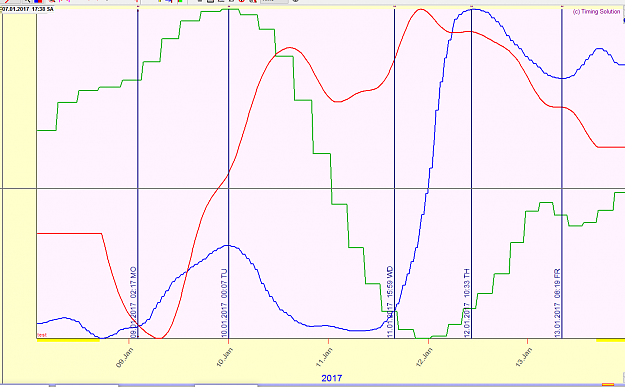
One more view with a Uranus right ascension projection line added last week and next week.... buy and sell lines slightly tweaked... will use this one for the end of the week recap...
What happens when the Moon make an aspect with Pluto? Last week it happened twice.... the first was the Moon sextile (60 degrees) to Pluto and the second was square (90 deg)... now for some backtesting.... the curve shows a 4 degree orb... beginning and ending of that aspect.
What can we use the achieve the following:
Identify the dominant cycles math or astro in the last 12 months.
Identify all years that has the same dominant cycles not patterns.
Define the dominant cycles in all of these years next 12 months.
Take the average of these next 12 months cycles for all similar years and apply it to generate the last 12 months forecast?
Can we do it with mt4 Fourier or TS or other tools?
What can we use the achieve the following: Identify the dominant cycles math or astro in the last 12 months. Identify all years that has the same dominant cycles not patterns. Define the dominant cycles in all of these years next 12 months. Take the average of these next 12 months cycles for all similar years and apply it to generate the last 12 months forecast? Can we do it with mt4 Fourier or TS or other tools?
Ignored
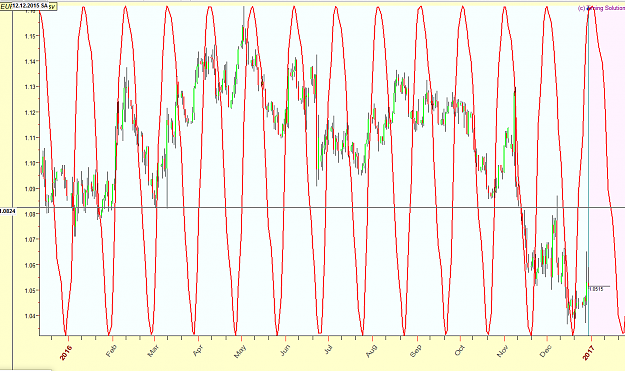
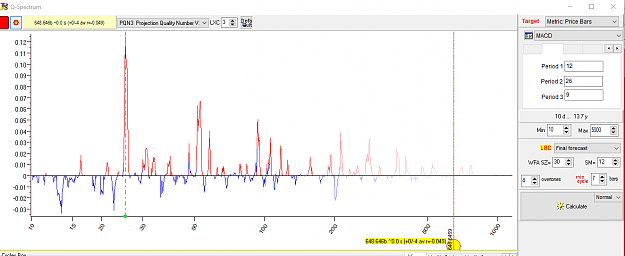
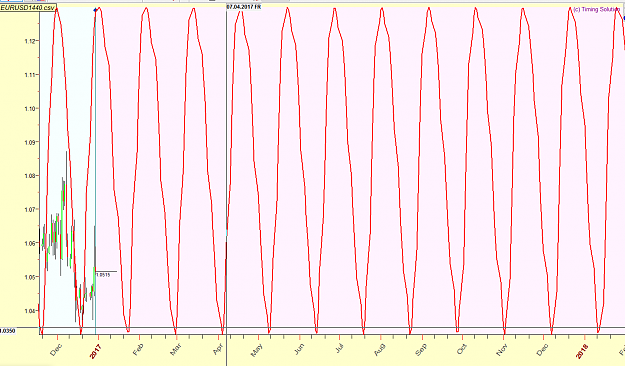
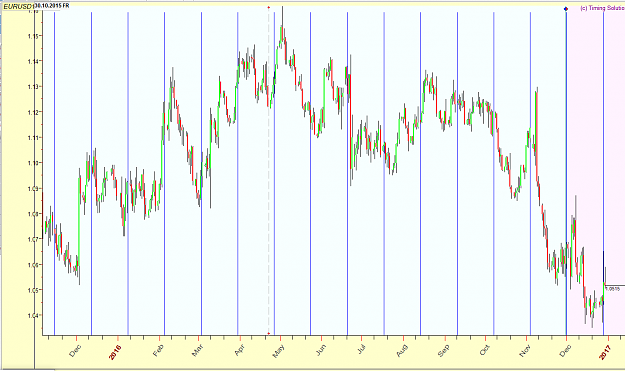
It took TS about 1 minute to find the most dominant cycle in the Euro.... I analyzed every day since Nov. 2002... and the program found that 25.28 days is the most prominent.... see how the past 12 months reacted to its highs and lows...
What can we use the achieve the following: Identify the dominant cycles math or astro in the last 12 months. Identify all years that has the same dominant cycles not patterns. Define the dominant cycles in all of these years next 12 months. Take the average of these next 12 months cycles for all similar years and apply it to generate the last 12 months forecast? Can we do it with mt4 Fourier or TS or other tools?
Ignored
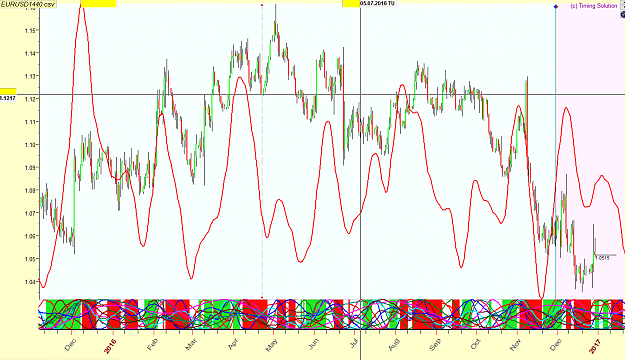
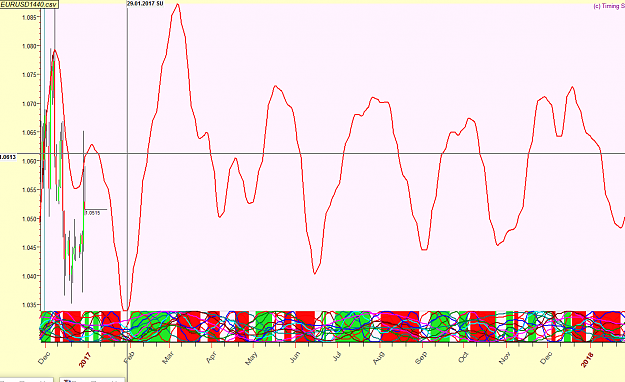
Here is a view with all of the cycles above a value of .02 in the Q spectrum selected and averaged together... last year and next year....
{quote} It took TS about 1 minute to find the most dominant cycle in the Euro.... I analyzed every day since Nov. 2002... and the program found that 25.28 days is the most prominent.... see how the past 12 months reacted to its highs and lows... Finally the cycle on the next 12 months... {image} {image} {image}
Ignored
Thanks a lot jnevins, which module is used to get this analysis ? is it available at the demo.
how is this compared to the seasonal charts that sixer referred to ?
I found the "Fourier_extrapolation" Indicator for MT5 also. So i can start the check which one of the predictions will show better results by myself. Sixer {image}
Shall i better concentrate to the "New Moon" dates for the indices (see DJI) shown from LP ? Sixer {image} {image}
Ignored
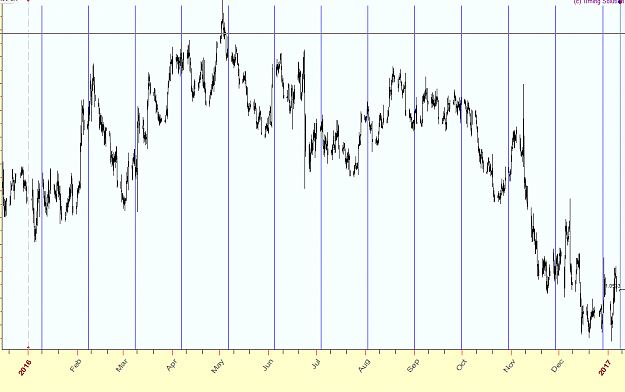
I don't really examine the DJIA just the Euro in an effort to simplify what is an already complicated (impossibly so) field of study. here is a chart of every new moon this past year on 1 hr bars EUR/USD
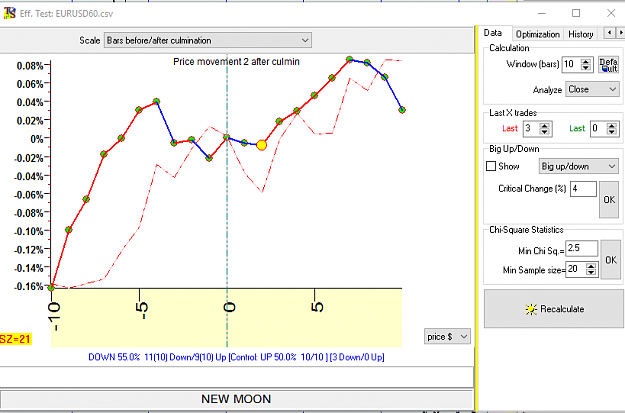
The second image is an efficiency test that shows most of the time, price goes up starting 10 hours before the culmination of the aspect to 5 hours before, and also hours 2,3,4,5,6 and 7 after the culmination, price also goes up. This is worth some screen time to backtest.