I found the "Fourier_extrapolation" Indicator for MT5 also.
So i can start the check which one of the predictions will show better results by myself.
Sixer
So i can start the check which one of the predictions will show better results by myself.
Sixer
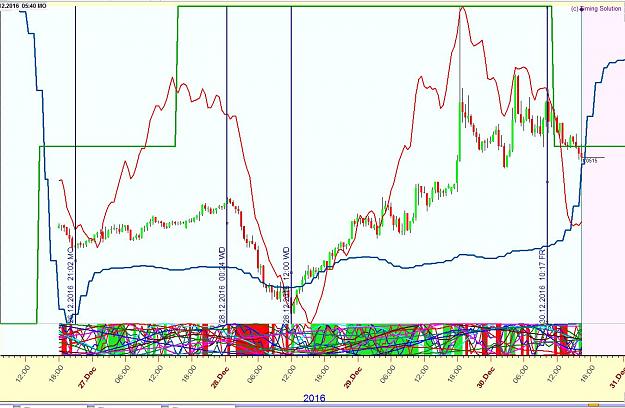
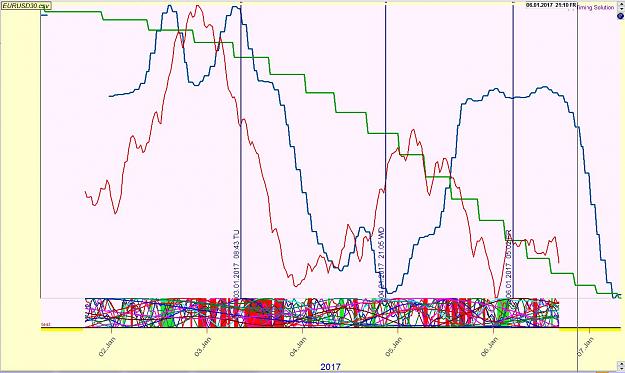
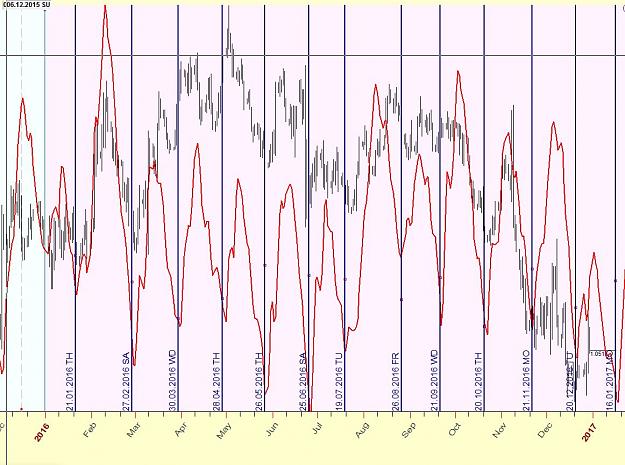
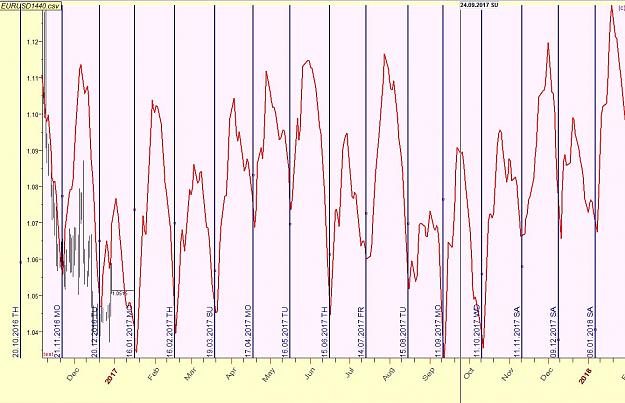
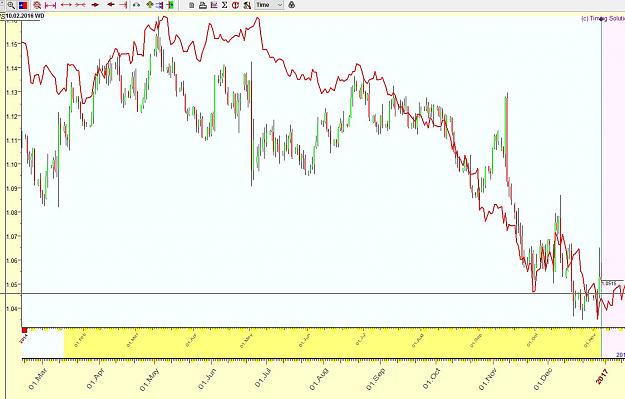
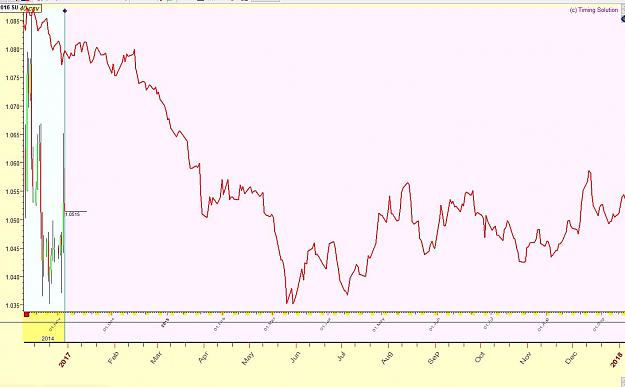
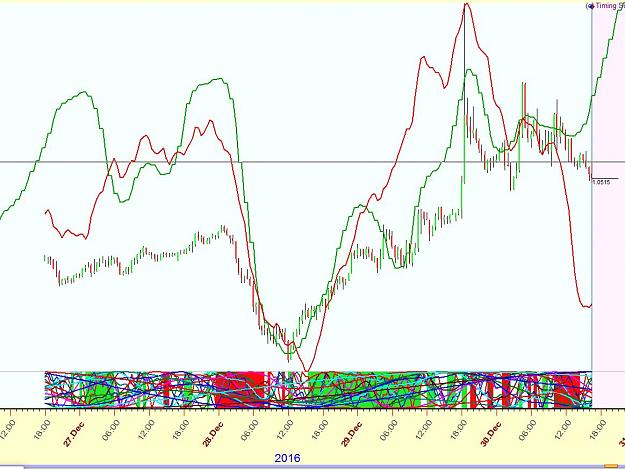
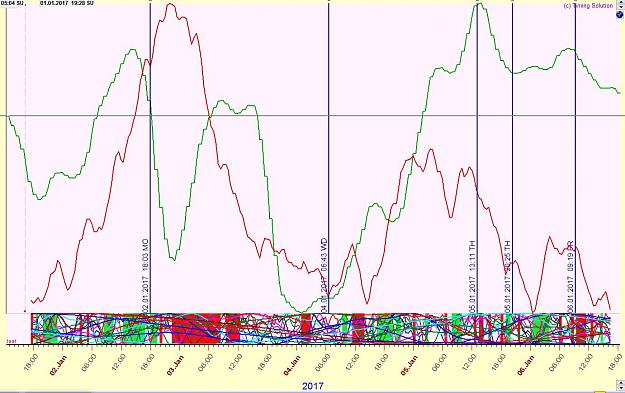
Attached Image