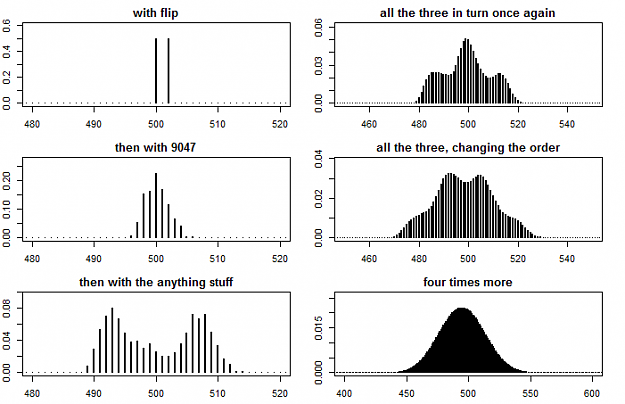
DislikedThe following charts demonstrate the for a 45% expectancy a system attain sufficient average reward/pay-off is still profitable (neglecting transnational costs). The equity curves from the simulation: {image} The histogram of the expectancy form 10000 simulations runs of 100 trades each (e.g 1 million simulated trade in total): {image} As you can see 2 (estimated) standard deviations from the (estimated) mean the expectancy is still positive (although not by very much ... especially if transaction costs are thrown into the mix!). 9047.Ignored
- #42
- Dec 30, 2016 5:41am Dec 30, 2016 5:41am
- Joined Aug 2011 | Status: Trader | 1,327 Posts
No greed. No fear. Just maths.
- #43
- Dec 30, 2016 8:33am Dec 30, 2016 8:33am
- Joined Aug 2011 | Status: Trader | 1,327 Posts


No greed. No fear. Just maths.
- #47
- Dec 31, 2016 6:01am Dec 31, 2016 6:01am
- Joined Aug 2011 | Status: Trader | 1,327 Posts
No greed. No fear. Just maths.
- #50
- Edited 4:27pm Dec 31, 2016 9:19am | Edited 4:27pm
- | Commercial User | Joined Apr 2013 | 4,366 Posts
- #51
- Dec 31, 2016 10:05am Dec 31, 2016 10:05am
- Joined Aug 2011 | Status: Trader | 1,327 Posts
No greed. No fear. Just maths.
- #54
- Edited Jan 1, 2017 8:29am Dec 31, 2016 2:09pm | Edited Jan 1, 2017 8:29am
- Joined Mar 2012 | Status: turning probability into profit | 1,550 Posts
Hunting High and Low
- #55
- Jan 1, 2017 8:43am Jan 1, 2017 8:43am
- Joined Aug 2011 | Status: Trader | 1,327 Posts
No greed. No fear. Just maths.
- #56
- Edited 9:38am Jan 1, 2017 9:25am | Edited 9:38am
- Joined Mar 2012 | Status: turning probability into profit | 1,550 Posts

Hunting High and Low
- #58
- Edited 10:09am Jan 1, 2017 9:58am | Edited 10:09am
- Joined Mar 2012 | Status: turning probability into profit | 1,550 Posts
Hunting High and Low
- #59
- Jan 1, 2017 10:08am Jan 1, 2017 10:08am
- Joined Sep 2016 | Status: Its my job to know what others dont | 1,348 Posts
WaBaS Where are Buyers and Sellers