I´m still working on my template in the 30 min time frame - but i installed the MT5 version. So, i can`t provide you the indicators for MT4.
Extrapolator indicator: I actually use the "Extrapolation Method".
Start the "extrapolation" from the last bar, so change "Last Bar" from "30" to "0".
Sixer
Extrapolator indicator: I actually use the "Extrapolation Method".
Start the "extrapolation" from the last bar, so change "Last Bar" from "30" to "0".
Sixer
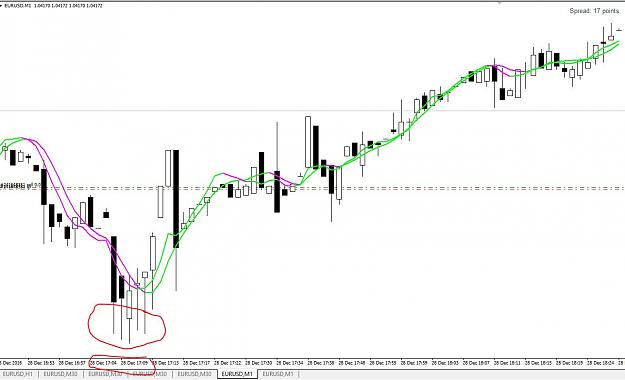
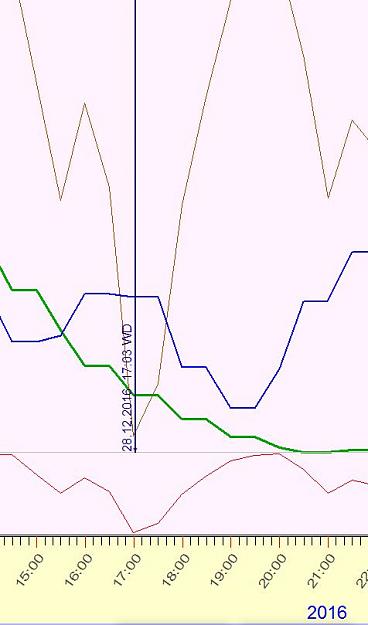
Attached Image