Daily Report on November 15, 2016
The U.S. dollar lost its luster against the Euro and the Japanese Yen on Tuesday, as investors took profit after a rally following Donald Trump’s victory last week and his pledges to boost fiscal spending. The dollar index which measures the strength of the greenback versus a basket of currencies, pulled back from one-year high and looked set for the first loss since last Wednesday
Oil prices were pushed higher today by profit-booking and speculations that U.S. shale output will drop in December. Crude prices added 2% to move away from three-month lows logged the day before as market analysts forecast shale oil production in the U.S. would fall to its lowest since April 2014 at 4.5 million barrels per day (bpd) next month.
In the Eurozone, German economic growth was reported to slow more than expected in the third quarter of 2016. According to the Germany's Federal Statistics Office, the economy grew by 0.2% on the quarter between July and September, missing consensus forecast for 0.3% growth, as net exports fell following the Brexit vote. The Statistics Office said private consumption has overtaken foreign trade as the most important growth driven in Germany.
Meanwhile in France, Insee (French national statistics bureau) reported that the country's Consumer Price Index was unchanged on the month in October due to falling services and food prices. Insee also added that the harmonized measure of annual price change known as HICP--rose 0.5% on year in October, the same as in September.
Technicals
GBPUSD
Fig: GBPUSD H4 Technical Chart
The British Pound extended losses from over one-month highs at 1.26445. As can be seen from the chart, the price action has crossed over both short-term and long-term MAs, suggesting a reversal into downtrend. Coupled with soaring ADX, RSI index has dropped below the 50 line, indicating further declines.
Trade suggestion
Sell Stop at 1.24000, Take profit at 1.23500, Stop loss at 1.24400
EURUSD
Fig: EURUSD H4 Technical Chart
EURUSD resumed its down moves after the pair crawled back from the lowest since early January at around 1.07150 recorded yesterday. The bullish sentiment which may result from profit-booking succeeded in preventing the market from falling into an oversold zone but failed to push the prices higher. The pair has still been under downward pressure from the two MAs and may retest the support at 1.07150 again.
Trade suggestion
Sell Stop at 1.07700, Take profit at 1.07150, Stop loss at 1.07800
USDCAD
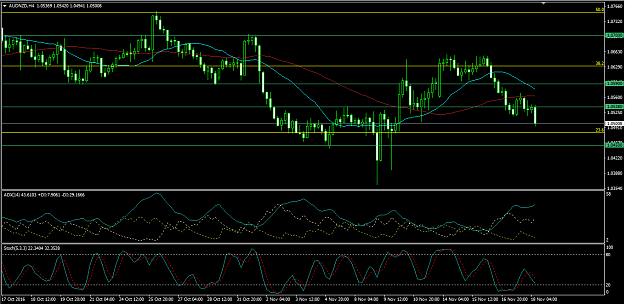
Fig: USDCAD H4 Technical Chart
USDCAD rebounded from 9-months high at 1.35882 recorded yesterday – which is also the 50% Fibonacci level. However, the short-term MA20 continued to support the price and may send it back to around the 50% retracement. RSI remaining in the bullish zone suggests a market in favor of buyers.
Trade suggestion
Buy Stop at 1.35400, Take profit at 1.35880, Stop loss at 1.35100
SILVER
Fig: SILVER H4 Technical Chart
SILVER has reversed lower at the handle of 17.075 – the level that has supported the metal yesterday. Silver corrects fell as low as 16.625 on Monday and sent its market into the oversold zone. Investors jumped in to buys the dips but sellers continued to damp the price lower. After a correction, the metal is anticipated to drop lower to test the 61.8% level.
Trade suggestion
Sell Stop at 16.900, Take profit at 16.550, Stop loss at 17.100
BRENT
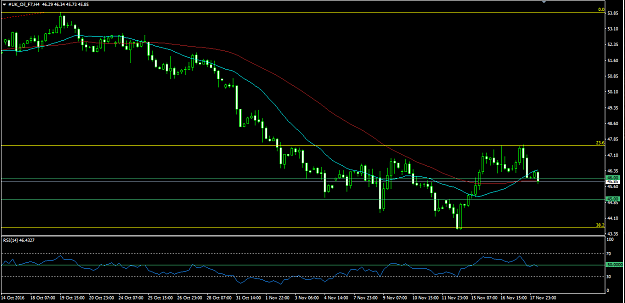
Fig: BRENT H4 Technical Chart
Brent has been on a strong rise that brought the commodity to as high as 46.00 resistance. The price has broken above the short-term MA20 but is struggling around the long-term MA50 and the 46.00 level. RSI has surpassed the 50 level, consolidating the up moves.
Trade suggestion
Buy Stop at 46.10, Take profit at 46.80, Stop loss at 45.80
NASDAQ 100
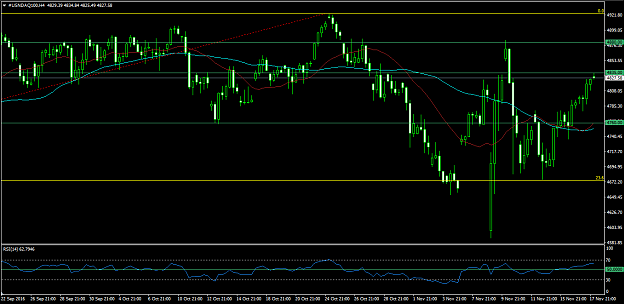
Fig: NASDAQ 100 H4 Technical Chart
NASDAQ 100 has been sliding after the index failed to break a couple of MAs which are hanging above the price action. As can be observed from the RSI chart, bears had jumped in to prevent the market from penetrating the bullish area. With long upper shadows in recent candles that indicate overwhelming sellers in the market, NASDAQ may reattempt the support at 23.6% level.
Trade suggestion
Sell Stop at 4699.00, Take profit at 4675.00, Stop loss at 4712.00
The U.S. dollar lost its luster against the Euro and the Japanese Yen on Tuesday, as investors took profit after a rally following Donald Trump’s victory last week and his pledges to boost fiscal spending. The dollar index which measures the strength of the greenback versus a basket of currencies, pulled back from one-year high and looked set for the first loss since last Wednesday
Oil prices were pushed higher today by profit-booking and speculations that U.S. shale output will drop in December. Crude prices added 2% to move away from three-month lows logged the day before as market analysts forecast shale oil production in the U.S. would fall to its lowest since April 2014 at 4.5 million barrels per day (bpd) next month.
In the Eurozone, German economic growth was reported to slow more than expected in the third quarter of 2016. According to the Germany's Federal Statistics Office, the economy grew by 0.2% on the quarter between July and September, missing consensus forecast for 0.3% growth, as net exports fell following the Brexit vote. The Statistics Office said private consumption has overtaken foreign trade as the most important growth driven in Germany.
Meanwhile in France, Insee (French national statistics bureau) reported that the country's Consumer Price Index was unchanged on the month in October due to falling services and food prices. Insee also added that the harmonized measure of annual price change known as HICP--rose 0.5% on year in October, the same as in September.
Technicals
GBPUSD
Fig: GBPUSD H4 Technical Chart
The British Pound extended losses from over one-month highs at 1.26445. As can be seen from the chart, the price action has crossed over both short-term and long-term MAs, suggesting a reversal into downtrend. Coupled with soaring ADX, RSI index has dropped below the 50 line, indicating further declines.
Trade suggestion
Sell Stop at 1.24000, Take profit at 1.23500, Stop loss at 1.24400
EURUSD
Fig: EURUSD H4 Technical Chart
EURUSD resumed its down moves after the pair crawled back from the lowest since early January at around 1.07150 recorded yesterday. The bullish sentiment which may result from profit-booking succeeded in preventing the market from falling into an oversold zone but failed to push the prices higher. The pair has still been under downward pressure from the two MAs and may retest the support at 1.07150 again.
Trade suggestion
Sell Stop at 1.07700, Take profit at 1.07150, Stop loss at 1.07800
USDCAD
Fig: USDCAD H4 Technical Chart
USDCAD rebounded from 9-months high at 1.35882 recorded yesterday – which is also the 50% Fibonacci level. However, the short-term MA20 continued to support the price and may send it back to around the 50% retracement. RSI remaining in the bullish zone suggests a market in favor of buyers.
Trade suggestion
Buy Stop at 1.35400, Take profit at 1.35880, Stop loss at 1.35100
SILVER
Fig: SILVER H4 Technical Chart
SILVER has reversed lower at the handle of 17.075 – the level that has supported the metal yesterday. Silver corrects fell as low as 16.625 on Monday and sent its market into the oversold zone. Investors jumped in to buys the dips but sellers continued to damp the price lower. After a correction, the metal is anticipated to drop lower to test the 61.8% level.
Trade suggestion
Sell Stop at 16.900, Take profit at 16.550, Stop loss at 17.100
BRENT
Fig: BRENT H4 Technical Chart
Brent has been on a strong rise that brought the commodity to as high as 46.00 resistance. The price has broken above the short-term MA20 but is struggling around the long-term MA50 and the 46.00 level. RSI has surpassed the 50 level, consolidating the up moves.
Trade suggestion
Buy Stop at 46.10, Take profit at 46.80, Stop loss at 45.80
NASDAQ 100
Fig: NASDAQ 100 H4 Technical Chart
NASDAQ 100 has been sliding after the index failed to break a couple of MAs which are hanging above the price action. As can be observed from the RSI chart, bears had jumped in to prevent the market from penetrating the bullish area. With long upper shadows in recent candles that indicate overwhelming sellers in the market, NASDAQ may reattempt the support at 23.6% level.
Trade suggestion
Sell Stop at 4699.00, Take profit at 4675.00, Stop loss at 4712.00