Hello, I am a noobie and was looking to get some help from you guys.
I tried couple different things to get the clouds to be transparent but I can't seem to get it to work. Could you guys show me how to set it up please?
{quote} ++++++++++++++++++++++++++++++++ I've been trying to reverse engineer your Tenken/Kijun settings. So far I've pulled out half of my hair (4 to be precise). It appears the yellow is the standard Kijun. Beyond that, I got nothing. Give a brother a break... homey... Meanwhile, back at the thread; It appears that Tenkan & Kijun are not used. Stony, can you confirm this?
Ignored
Hi,
I am not pursuing the Ichimoku approach now tbh so it wouldn't be prudent of me to continue discussing Ichi any further, sorry.
Granted it can work and clearly does so for some here, but it's too ambiguous and not obvious for the way I like to trade which is always to keep it simple, without too much to consider, in other words, if it aint obvious I aint interested lol.
For example, 3 select mas does a similar job, but a heck of a lot easier (for me at least).
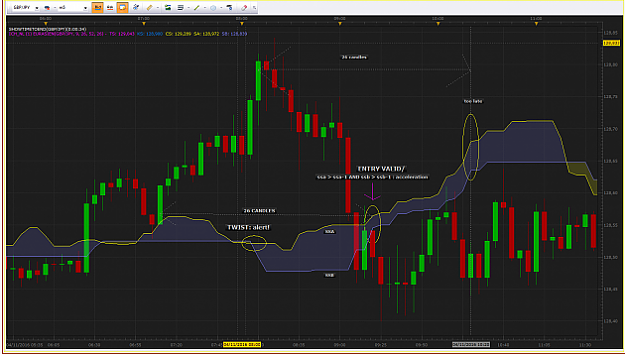
{quote} Hi Pundit Could you explain your trade on GJ? i Cant' see a bullish signal at the moment of your entry... I give you my opinion: Your entry is too late. Stony said: Twist is the alert. Then, for an entry, we need an acceleration. This acceleration is showing...
Ignored
Hi Tyross,You yourself have answered your question, it was a valid signal as you marked it but yes it was late too as shown as per method but I do not trade every twist, there should be a small trend built where there is no support resistance nearby, in this case a little resistance was there but I still took the trade as london had opened and I was expecting a small movement, however my SL would have the same as it was so even If I had entered the trade as per your signal my SL would even have hit, Stony rightly said that we should not trade before NFP but sadly I did not notice NFP today as I was very busy in office, pairs shot in NY session. I hope its clear now.
{quote} Hi Tyross,You yourself have answered your question, it was a valid signal as you marked it but yes it was late too as shown as per method but I do not trade every twist, there should be a small trend built where there is no support resistance nearby, in this case a little resistance was there but I still took the trade as london had opened and I was expecting a small movement, however my SL would have the same as it was so even If I had entered the trade as per your signal my SL would even have hit, Stony rightly said that we should not...
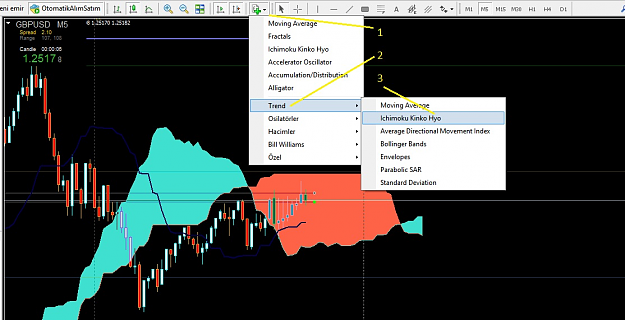
Hi Tyross..could you pls share the ichi indicator you are using in your chart. I want the cloud area to be translucent like that or completely clear. The standard ichi indie on MT4 has dashed lines across it and it makes the chart messy and unclear. A lot of people also on this thread asking for alternative ichi indicators like the ones being posted in screenshots. Many Thanks!
{quote} Hi Pundit Could you explain your trade on GJ? i Cant' see a bullish signal at the moment of your entry... I give you my opinion: Your entry is too late. Stony said: Twist is the alert. Then, for an entry, we need an acceleration. This acceleration is showing by SSA >SSA-1 AND SSB > SSB-1 {image}
Hi Tyross..could you pls share the ichi indicator you are using in your chart. I want the cloud area to be translucent like that or completely clear. The standard ichi indie on MT4 has dashed lines across it and it makes the chart messy and unclear. A lot of people also on this thread asking for alternative ichi indicators like the ones being posted in screenshots. Many Thanks! {quote} {image}
Ignored
Hi Exiled-brit
The ichi indicator in my chart is ichimoku standard... but on TS2 of FXCM. Not for MT4...
Hi Tyross..could you pls share the ichi indicator you are using in your chart. I want the cloud area to be translucent like that or completely clear. The standard ichi indie on MT4 has dashed lines across it and it makes the chart messy and unclear. A lot of people also on this thread asking for alternative ichi indicators like the ones being posted in screenshots. Many Thanks! {quote} {image}
{quote} Hi, I am not pursuing the Ichimoku approach now tbh so it wouldn't be prudent of me to continue discussing Ichi any further, sorry. Granted it can work and clearly does so for some here, but it's too ambiguous and not obvious for the way I like to trade which is always to keep it simple, without too much to consider, in other words, if it aint obvious I aint interested lol. For example, 3 select mas does a similar job, but a heck of a lot easier (for me at least). Hope it works out for you tho...g/l LL
Ignored
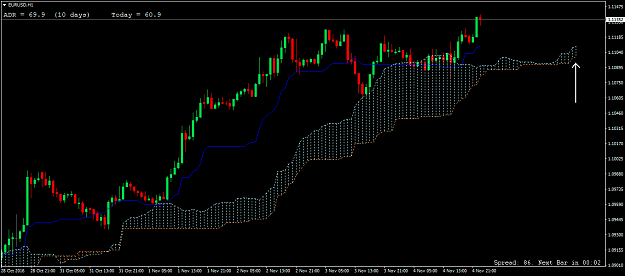
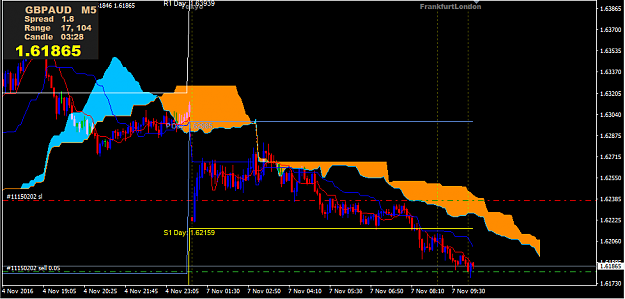
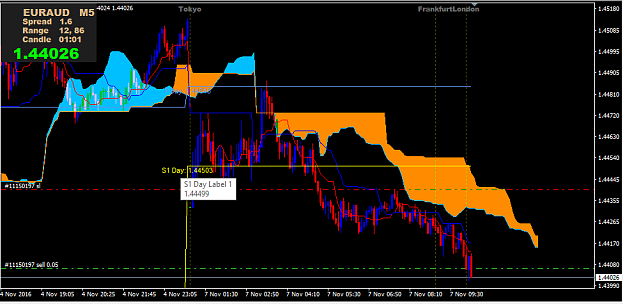
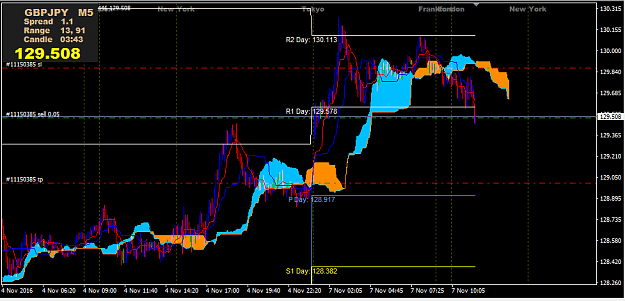
Hello Landline After initially struggling to understand this system I think that I know what a signal to enter is now. My understanding is that you look at the right hand side of the screen at the very end of the projected forward Cloud. When the top and bottom of the cloud is pointing up that is a signal to enter a buy immediately after a candle close.
Opposite for a sell. The screenshot shows this.
Hope this helps
{quote} Hello Landline After initially struggling to understand this system I think that I know what a signal to enter is now. My understanding is that you look at the right hand side of the screen at the very end of the projected forward Cloud. When the top and bottom of the cloud is pointing up that is a signal to enter a buy immediately. Opposite for a sell. The screenshot shows this. Hope this helps {image}
Ignored
Its stonyheart's original rule. Landline has different rule. As usual, he jump in every thread and trying to modify the OP's shared strategy into a simpler one but difficult to understand and unproven if it works. Landline, I suggest, test your strategy first before you share.
{quote} Hello Landline After initially struggling to understand this system I think that I know what a signal to enter is now. My understanding is that you look at the right hand side of the screen at the very end of the projected forward Cloud. When the top and bottom of the cloud is pointing up that is a signal to enter a buy immediately after a candle close. Opposite for a sell. The screenshot shows this. Hope this helps {image}
Ignored
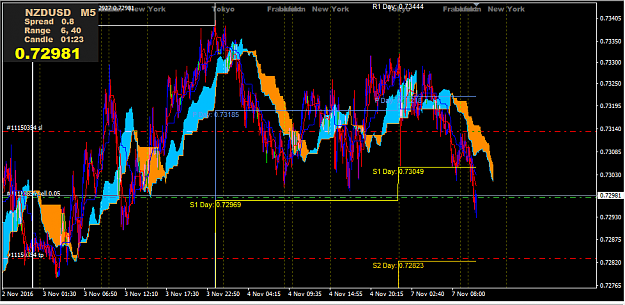
I spent some time back testing this system on 1H charts on 4 different currency pairs (I prefer longer time frames since they tend to be easier to trade and there is less noise). The results are quite good, but I found that it was better to wait for price to pull back after getting a signal, and then enter from there (as long as price doesn't break to the other side of the cloud during the pullback). The hit rate is 50%, but the R:R is around 1:3 which is what makes it profitable. The downside is that there are, on average, only about 4 valid setups per month (average trade hold time seems to be around 3 - 5 days). If you select about 4 uncorrelated pairs, this would give you enough opportunities to trade from. So overall, this looks like a realistic and profitable system, based on my back testing so far. I will start doing forward testing this week and keep you guys posted.
| Joined Jan 2016 | Status: Intermarket analysis is key |77 Posts
Quoting digf {quote} Hello Landline After initially struggling to understand this system I think that I know what a signal to enter is now. My understanding is that you look at the right hand side of the screen at the very end of the projected forward Cloud. When the top and bottom of the cloud is pointing up that is a signal to enter a buy immediately after a candle close. Opposite for a sell. The screenshot shows this. Hope this helps {image} I spent some time back testing this system on 1H charts on 4 different currency pairs (I prefer longer time frames since they tend to be easier to trade and there is less noise). The results are quite good, but I found that it was better to wait for price to pull back after getting a signal, and then enter from there (as long as price doesn't break to the other side of the cloud during the pullback). The hit rate is 50%, but the R:R is around 1:3 which is what makes it profitable. The downside is that there are, on average, only about 4 valid setups per month (average trade hold time seems to be around 3 - 5 days). If you select about 4 uncorrelated pairs, this would give you enough opportunities to trade from. So overall, this looks like a realistic and profitable system, based on my back testing so far. I will start doing forward testing this week and keep you guys posted.
Thanks for that info. It adds a little confidence for this system.
{quote} I spent some time back testing this system on 1H charts on 4 different currency pairs (I prefer longer time frames since they tend to be easier to trade and there is less noise). The results are quite good, but I found that it was better to wait for price to pull back after getting a signal, and then enter from there (as long as price doesn't break to the other side of the cloud during the pullback). The hit rate is 50%, but the R:R is around 1:3 which is what makes it profitable. The downside is that there are, on average, only about 4...
Ignored
Hi Steve
The idea about 4 uncorralated pairs is excellent.
Have you tried a short TF (M 5) but with a small TP ( no more 10 pips ) ?
Joined Aug 2012
|
Status: Reading the market
|327 Posts
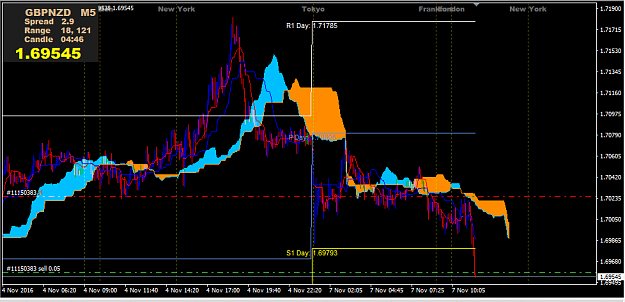
@Stonyheart
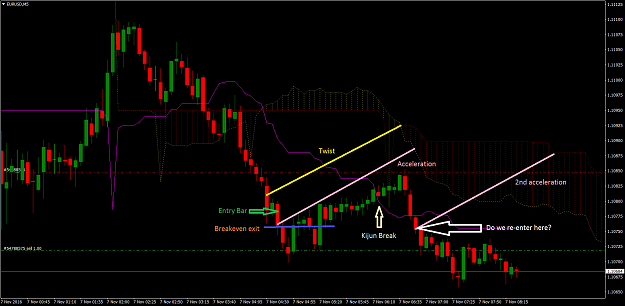
Suppose we got Kumo twist and acceleration signal to enter and our stop loss got hit. Do we enter on 2nd acceleration with same Kumo twist or do we need fresh Kumo twist and acceleration to enter in the same direction again? Please see the chart below.