This is a thread dedicated to the development of RAMZAN's indicator and trading: http://www.forexfactory.com/showthre...74#post9201174
Here's the latest version of the indicator, the ea development should probably be started after reaching a level of satisfaction with the indicator.
MACD_Dot Notes:
The rules implemented for suppression - may not be optimal.
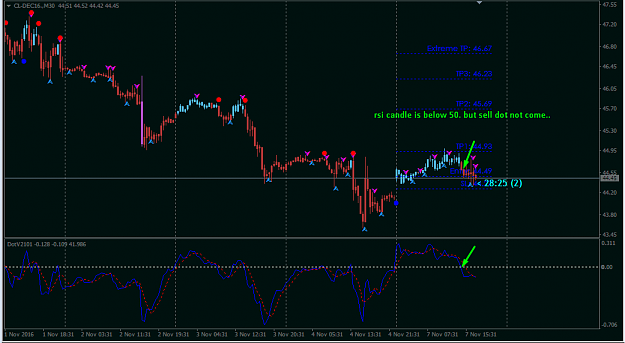
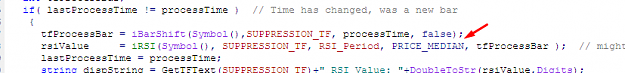
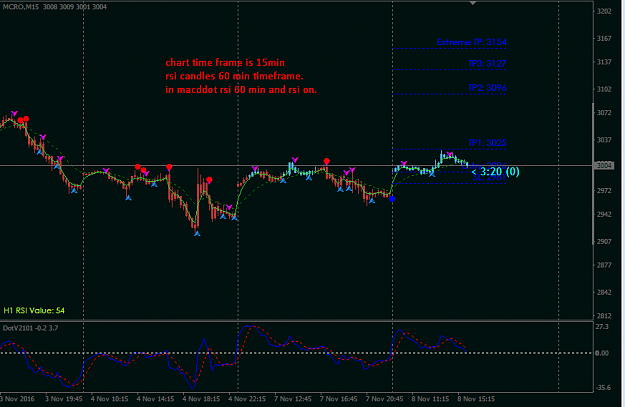
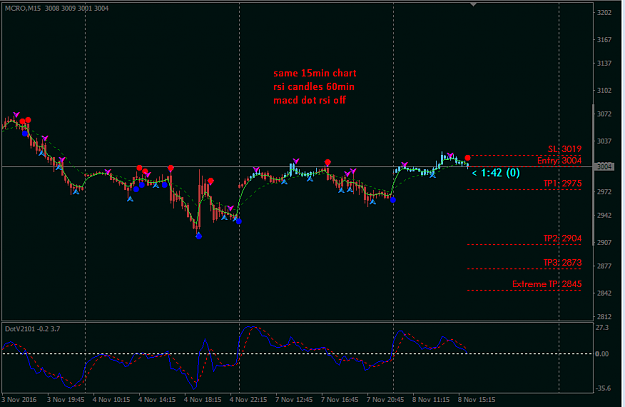
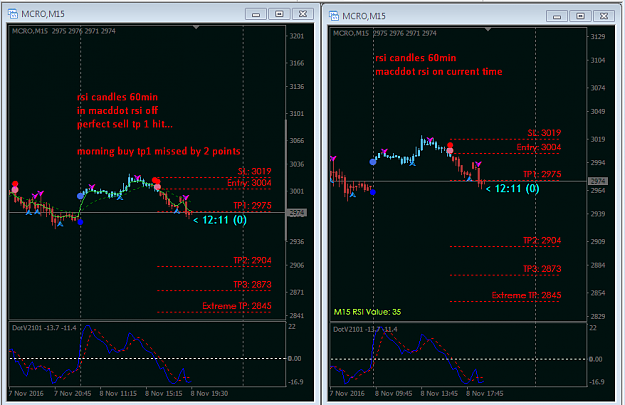
RSI: Allow long signals if RSI > 50; allow short signals if RSI < 50.
------Allow long if signal is < 20; Allow short if signal is > 80
CCI: Allow long signals if CCI is above 60; allow short signals if CCI below -60.
Sto: Allow long signals if Sto is below 40; allow short signals if Sto is above 40.
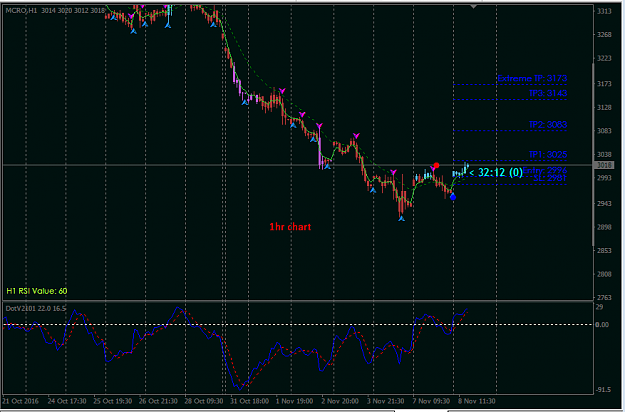
Next Bar Forecast Notes:
There is a text display on the lower left, it has Five elements that may be clicked on to select options:
- The calculation mode: I think only "Mode: Same Time" makes sense.
- Lines can be turned on or off to see the history of next bar forecasts on the chart.
- Forecast lines can be turned off (or back on).
- Display of the forecast for each timeframe can be cycled through.
- Click on the EA name to see the forecast line for the chosen forecast (nice for when all forecast lines are off).
RAMZAM Range Change
- Indicator attempts to detect the beginning of a change in the range of the last few bars (Range change test bars = 17).
- It's a component in using the Stochastic indicator for trading. It uses a 'odd' set of stochastic values, kPeriod = 20; dPeriod = 12; slowing = 12, instead of the default 5,3,3. Edit the code and change it to what you want.
- It will display the price at the time a signal is given. Click on "Last Signal" to remove the price marks. Click again to get price marks on newly made signals (but still having the history removed, unless you re-start the indicator - lets you clean up the display). Of course, if you turn off the market display, you will have nothing to click on.
Holt double exponential smoothing
- This is a re-write of an indicator that wouldn't draw but I thought seemed like a superior 'super-trend'. With the re-write, it seems to draw reliably.
SingleBarValuesSimple
- Display the values associated with a bar. Display can be set to any location by setting an Anchor Corner, vertical and horizontal offset. Click the word "PERIOD" to increment the Time Frame of the bar, the timeframe text to decrement the Time Frame of the bar, enter a bar in the text entry box to chose a bar, click "Bar Up" to select the next older bar, click "Bar Dn" to select the next newer bar.
Here's the latest version of the indicator, the ea development should probably be started after reaching a level of satisfaction with the indicator.
MACD_Dot Notes:
The rules implemented for suppression - may not be optimal.
RSI: Allow long signals if RSI > 50; allow short signals if RSI < 50.
------Allow long if signal is < 20; Allow short if signal is > 80
CCI: Allow long signals if CCI is above 60; allow short signals if CCI below -60.
Sto: Allow long signals if Sto is below 40; allow short signals if Sto is above 40.
Next Bar Forecast Notes:
There is a text display on the lower left, it has Five elements that may be clicked on to select options:
- The calculation mode: I think only "Mode: Same Time" makes sense.
- Lines can be turned on or off to see the history of next bar forecasts on the chart.
- Forecast lines can be turned off (or back on).
- Display of the forecast for each timeframe can be cycled through.
- Click on the EA name to see the forecast line for the chosen forecast (nice for when all forecast lines are off).
RAMZAM Range Change
- Indicator attempts to detect the beginning of a change in the range of the last few bars (Range change test bars = 17).
- It's a component in using the Stochastic indicator for trading. It uses a 'odd' set of stochastic values, kPeriod = 20; dPeriod = 12; slowing = 12, instead of the default 5,3,3. Edit the code and change it to what you want.
- It will display the price at the time a signal is given. Click on "Last Signal" to remove the price marks. Click again to get price marks on newly made signals (but still having the history removed, unless you re-start the indicator - lets you clean up the display). Of course, if you turn off the market display, you will have nothing to click on.
Holt double exponential smoothing
- This is a re-write of an indicator that wouldn't draw but I thought seemed like a superior 'super-trend'. With the re-write, it seems to draw reliably.
SingleBarValuesSimple
- Display the values associated with a bar. Display can be set to any location by setting an Anchor Corner, vertical and horizontal offset. Click the word "PERIOD" to increment the Time Frame of the bar, the timeframe text to decrement the Time Frame of the bar, enter a bar in the text entry box to chose a bar, click "Bar Up" to select the next older bar, click "Bar Dn" to select the next newer bar.
Attached File(s)