Hello to all users of the forum, first I want to apologize for my english to be able to write and read using google translator, I promise that one day I will endeavor to learn English well.
In this thread I wanted to start a discussion so that everyone can participate and exchange ideas on my investment method.
Do not use any indicators on the chart of any kind and therefore for beginners who find it easier to have an indication from an oscillator, it may seem more difficult as a strategy.
These are the rules I use for my trading:
1) clean chart without any indicators
2) Trend line end support end resistence
3) in some cases invest to breakage of the points won and others to rebound, I will explain later how I choose my decision
4) I try to support and resistance lines on the weekly chart first, then the day and then on the lower ones.
Depending on the day, looking for investments in long range on the D1 or W1 (almost never) and then up to the M15 for a faster trading.
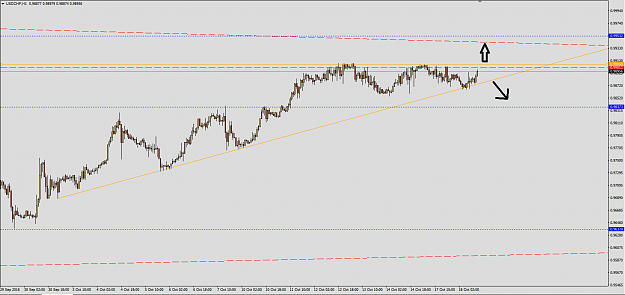
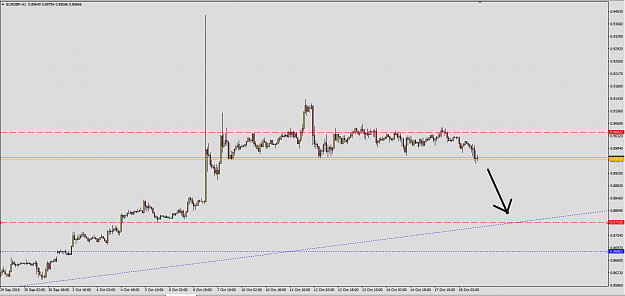
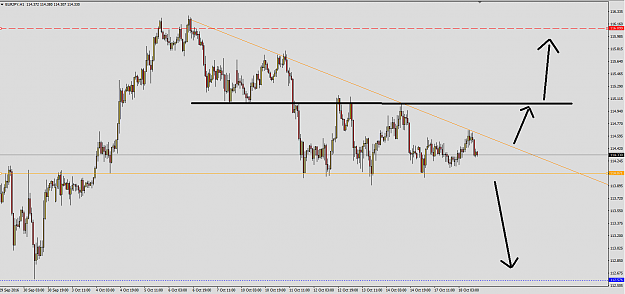
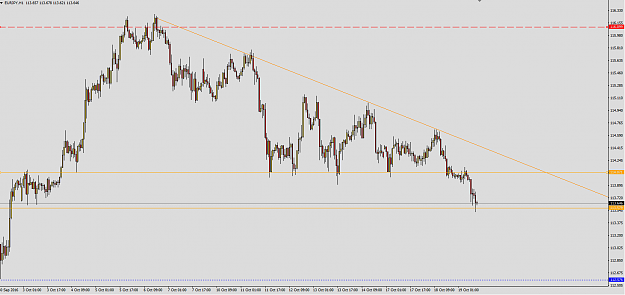
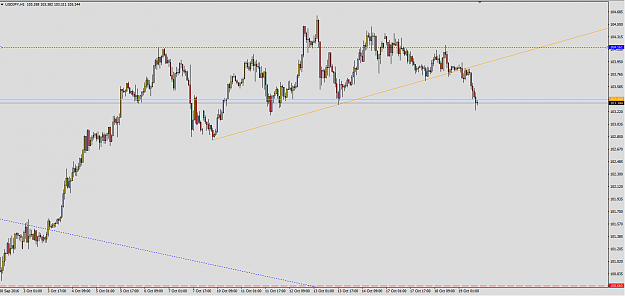
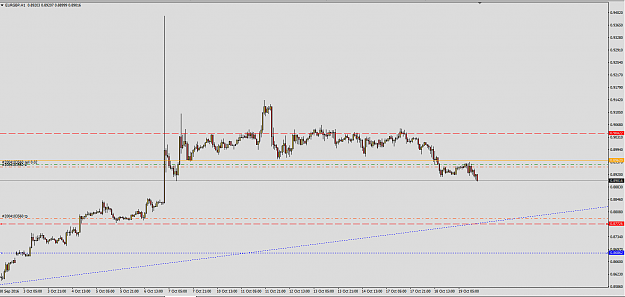
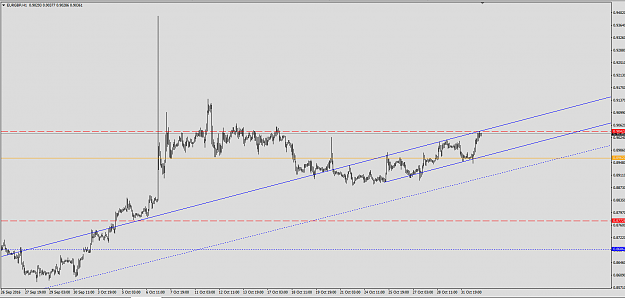
here is an example of one of my graphic:
Legend:
red dashed line, are the support and resistance found on W1
Blue dotted lines are the strengths and the media found on the D1
orange solid line, indicates support and resistance in the graph H1
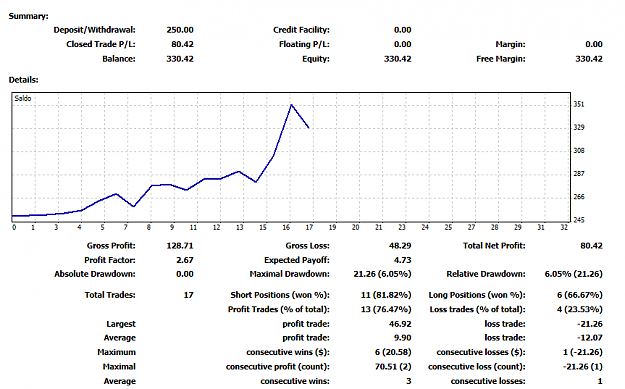
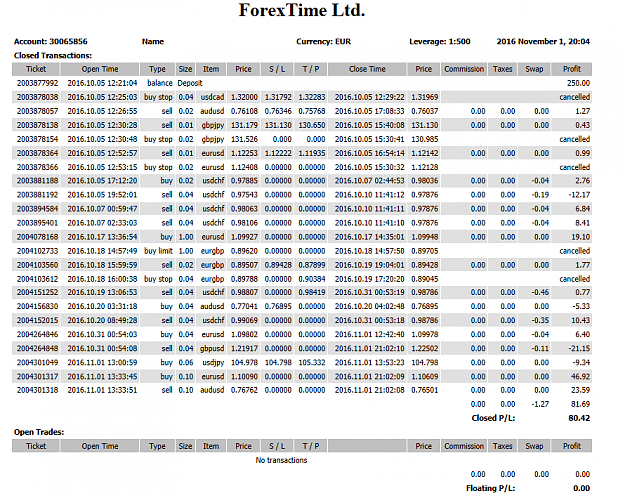
Money Management:
In total with the operations I try not to go over 10% of my account for each transaction instead invest between 3.2% and almost always I try to keep a R: R of at least 1: 3
In this thread I wanted to start a discussion so that everyone can participate and exchange ideas on my investment method.
Do not use any indicators on the chart of any kind and therefore for beginners who find it easier to have an indication from an oscillator, it may seem more difficult as a strategy.
These are the rules I use for my trading:
1) clean chart without any indicators
2) Trend line end support end resistence
3) in some cases invest to breakage of the points won and others to rebound, I will explain later how I choose my decision
4) I try to support and resistance lines on the weekly chart first, then the day and then on the lower ones.
Depending on the day, looking for investments in long range on the D1 or W1 (almost never) and then up to the M15 for a faster trading.
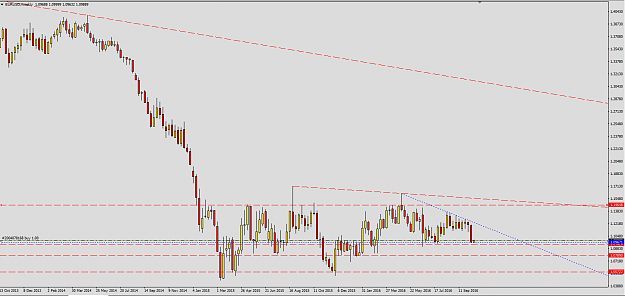
here is an example of one of my graphic:
Attached Image (click to enlarge)
Legend:
red dashed line, are the support and resistance found on W1
Blue dotted lines are the strengths and the media found on the D1
orange solid line, indicates support and resistance in the graph H1
Money Management:
In total with the operations I try not to go over 10% of my account for each transaction instead invest between 3.2% and almost always I try to keep a R: R of at least 1: 3