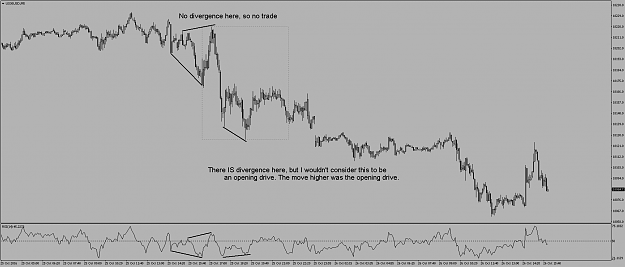
We only look for divergence on M5 chart [just bog standard divergence. Not hidden].
We only look for this around the time NYSE opens, and for a maximum of a couple of hours afterwards.
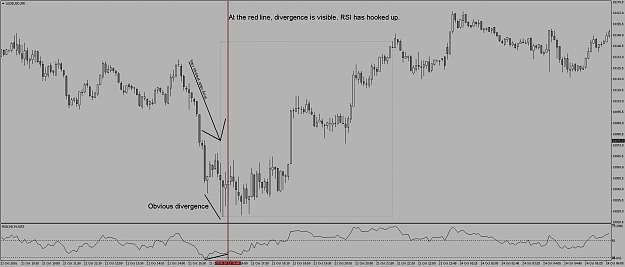
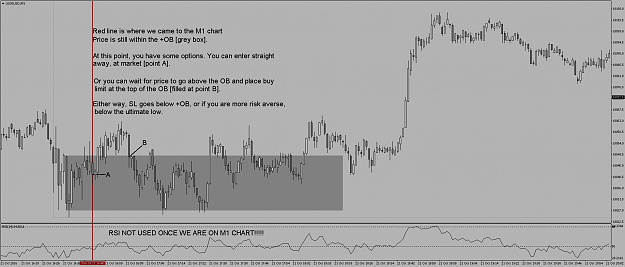
As soon as you see M5 divergence, switch to the M1 chart and look for the OB [Order Block] at the extreme of the move. Take your entry from when price moves back to the OB level. Sometimes, as soon as you switch to the M1 chart, you'll see price is already within the OB level. In that case, I enter at market. Sometimes, price may not go back into the OB level and you don't get an entry. SL goes on the other side of the OB.
RSI is NOT used on M1 chart. RSI is just used to give us a clue [divergence] on the M5 chart that the open drive/fakeout/false move, whatever you want to call it, has reached its limit.
M1 entry technique is price action only, but not the kind of price action drivel that most people promote.
Don't think I posted anything about targets. TP is at the opposing liquidity pool on M1. Will post example shortly.
It's very simple guys. Maybe I didn't explain it well, so apologies for that.
Some days you won't get a trade.
Some days the R on the trade will be fantastic. 1:10 and above is not uncommon, so you don't need it to give you a trade every day.
For those who say [can't remember the name, but now blocked ] that you can't trade with such a tight stop, my response is as follows:
Do you have data on THIS SPECIFIC setup? Do you have a statistically significant set of data, utilising this specific M5 divergence, at this specific time, with this specific M1 entry technique, and this specific target method? If you have a data set of 100+ instances and can show me that it doesn't work, THEN I'll listen to you...............
Just think about what is happening in the charts. Specifically, what piece of action are we trying to benefit from?
We are hoping to benefit from a false move, designed to suck in all the retail traders.
So, if that false move is down, what does that mean? Retail traders have jumped in, thinking it's going to hell. Where do they place their stops?
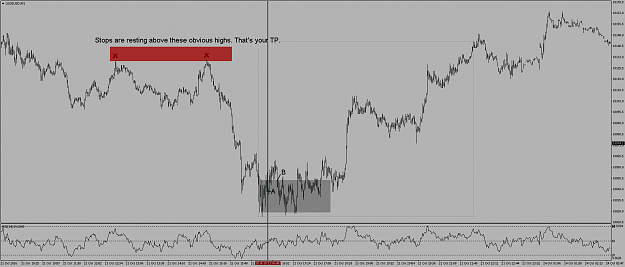
They place their stops above obvious highs. THAT's a liquidity pool.
So, in the example below, it's HIGHLY likely that price will move back to AT LEAST those highs.
Why?
Well, it may be that price does a fake move down because the real move is up. That being the case, price will come back up, taking out those highs and continuing higher.
OR.
It may do 2 fakeouts. Let's say the real move is intended to be down. Lots of retail get short. But they can't be allowed to be correct. So price moves back up and takes their stops at that liquidity pool.
In either scenario, it's likely that those highs will be violated.....................
If that's too complicated to take in, just think [using the example below], if I was short, where would I put my stop? Answer: above those highs..... Well, that's your target now you are on the same side as the big boys, eating retail for breakfast!!!
Won't be around for a little while now, but hope that's given you everything you need. Will try to get through the PMs soon.
Keep posting questions and charts guys [if you have any], and I'll reply later in the week.
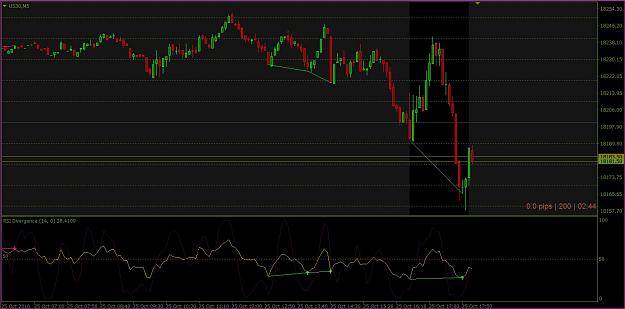
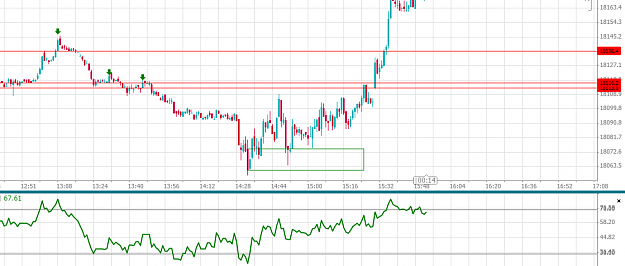
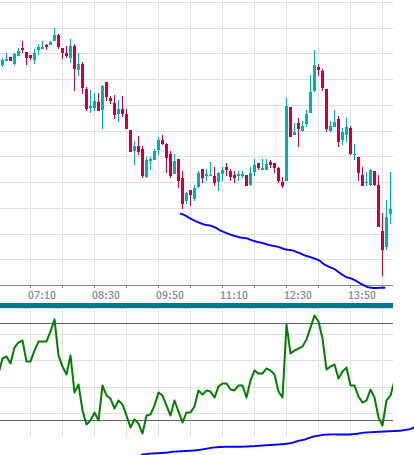
I'm still getting my head around which 1min Order Block targets are likely to be tagged but here's my take on today's trade. 2nd chart - slight 5 min RSI divergence after a drive down that printed pre-open. 1st chart - 1min entry Order Block with the green arrows indicating possible target OBs. {image} {image}
Ignored
If the divergence you marked on the 5 min is correct, the I think the entry would have been on the 14:36 U.K time candle taking out the last down candle on the 1 min chart.
I'm still getting my head around which 1min Order Block targets are likely to be tagged but here's my take on today's trade. 2nd chart - slight 5 min RSI divergence after a drive down that printed pre-open. 1st chart - 1min entry Order Block with the green arrows indicating possible target OBs. {image} {image}
Ignored
Your OB is correct in my opinion, but on 5 min to identify a divergence should we go that far back or should the divergence occur wholly after the market open time that is 9:30 NY?
{quote} Your OB is correct in my opinion, but on 5 min to identify a divergence should we go that far back or should the divergence occur wholly after the market open time that is 9:30 NY?
Ignored
That's what I was thinking, the pre-market should probably be ignored, therefore no trade today :-D
I am guilty of lurking but I can not resist any longer
I understand the concept, the divergence and all... my only question is the TF used to identify the OB ?
On your very first chart I don't have divergence on M5 for the short that you took but I do however have divergence for the long just before on M5
{quote} Your OB is correct in my opinion, but on 5 min to identify a divergence should we go that far back or should the divergence occur wholly after the market open time that is 9:30 NY?
Ignored
From what I can see in Gt3rs' post#68, the 'opening drive' down is pre-market and the divergence straddles pre-market (09:05) and the first 10 mins after the open.
I stand to be corrected, just wanted to bring it up to make sure we're all completely clear on the setup.
{quote} From what I can see in Gt3rs' post#68, the 'opening drive' down is pre-market and the divergence straddles pre-market (09:05) and the first 10 mins after the open. I stand to be corrected, just wanted to bring it up to make sure we're all completely clear on the setup.
Ignored
sidefx.. I think you have the OB correct, and divergence is there but not clean. I guess it's down to experience/study on how well a divergence that isn't "clean" would perform.