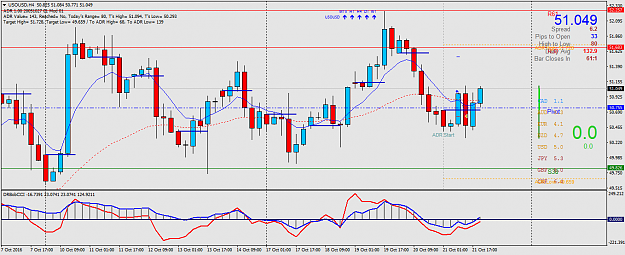
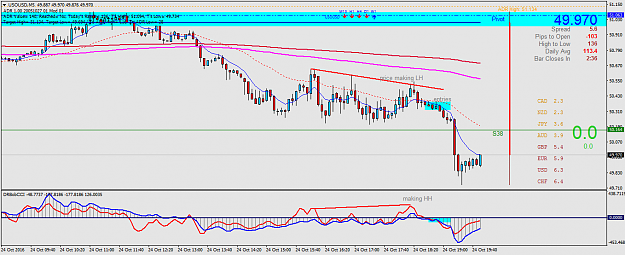
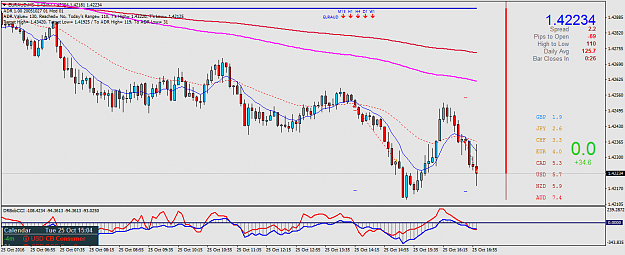
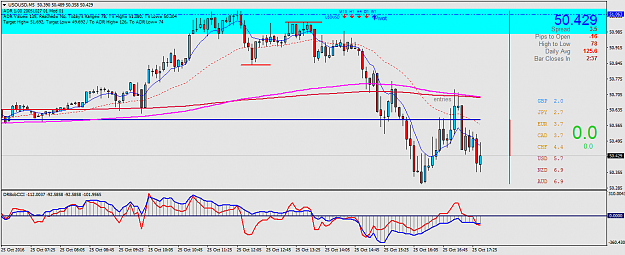
took profit a bit too early. Target would have been hit if the trade was left aside...anyway...took a loss with oil as data from Canada was not good
the cautious seldom err....C
1
Looking for simple arrow indicator 0 replies
lets develop a system which is very very simple but effective. 7 replies
Can anyone add a simple crossover arrow to this? 2 replies
Disliked{quote} Sir, would you discuss the reasoning behind this trade? When you are scalping the 5-min chart, what do you usually look at on the higher TF ? I can see you enter after a rejection candle off the 10ema on 5-min chart. But that is almost all I can see. Thank you.Ignored
Disliked{quote} Hi antonym, my strategy is very simple...I am a fan of the 34 ema and when scalping on the 5 min I will have the 34 ema on the 15 min and 30 min on the chart, shown by the magenta and red lines. I will take shorts when price is below these lines and vice versa. I won't look beyond the 1 hour tf when scalping on the 5 min. Hope this helpsIgnored
Disliked{quote} Thank you Sir. It helps a lot my understanding. When you took trade on M15 (primarily with-trend trades), do you also consider the price location with respect to 34ema on H1 and H4? How about the 34ema on D1? It seems to me that you are also taking some counter-trend trades, for example, the Oil buy trade on M15 yesterday. Do you consider the 34ema on higher timeframe for these counter-trend trades? Thank you.Ignored
Dislikedhere is the daily of the kiwi...If I went long at where the red vertical line is, is this ct or trend following? I will wait for some replies before going further {image}Ignored
Disliked{quote} Thank you for the reply pips29. I consider the Oil buy trade a counter trend trade because at the time (a) 10ema is below 34ema on H1 and H4. (b) price has been staying below the H1 and H4 34ema the whole time before the buy trade is taken. I agree that when the buy trade is taken, price has pushed above the H1 and H4 34ema. Hence, if the definition of "with-trend"/"counter-trend" is made with regards to price location above or below the 34 ema on higher TF, then it should be considered as with-trend in that definition. According to that...Ignored
DislikedI have just put the 200 ema on the daily chart of the kiwi and by the simple definition it is uptrend when price is above and vice versa. Moreover you can see hh,hl. As I am not trading H4, it won't matter to me if I did not bother to look at the daily. I am scalping using the 5 min. You don't need such big tf when trading 5 or 15 min chart {image}Ignored
Disliked{quote} Hi pips29, The sell trade of EU, I see that price exhibit some toppish pattern and you entered after price broke below the higher TF 34ema, but I find it difficult to understand the reason you decided to stay in it for very long time despite the price retracing against you.Could you discuss a bit more when you have time? Also is there any special meaning of the cyan blue rectangle area marked on chart? Thank you.Ignored
DislikedI somehow missed this set up...Price is below the 34 ema on H1 and was making LH but CCi was making HH. There were a few entries that can be taken as highlighted in blue which corresponded with the 14cci passing down thru' the zero line...will catch it next time {image}Ignored