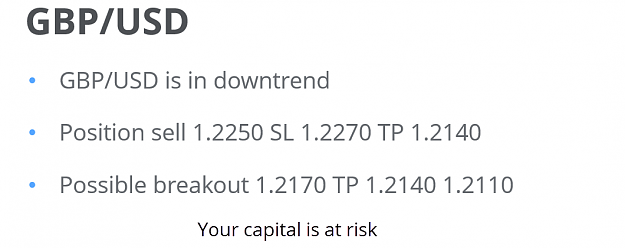
GBP/USD
4 hour https://fxmedia.s3.amazonaws.com/art...10-2016gu4.png
The GBP/USD is moving in between support and resistance and building a contracting triangle. The Cable is now challenging the support trend line (green). A break below it could see price develop a bearish breakout to retest the Fibonacci levels of wave X (blue). A break above resistance (orange) could see the development of a wave Y (blue) within wave 4 (green).
1 hour https://fxmedia.s3.amazonaws.com/art...10-2016gu1.png
The GBP/USD is in a wedge and has support (green) and resistance (red) trend lines nearby which offer bounce and break spots.
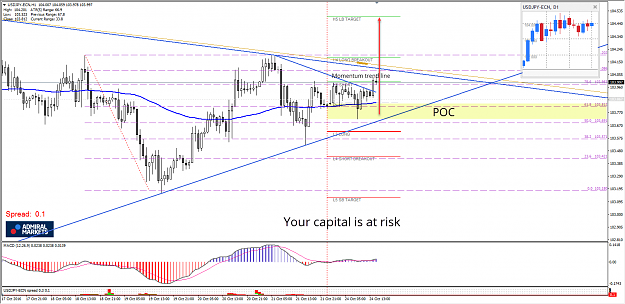
USD/JPY
4 hour https://fxmedia.s3.amazonaws.com/art...10-2016uj4.png
The USD/JPY is building a sideways zone in front of the daily top (brown) but price seems to breaking above the previous wave 1 (purple), which could confirm the start of a larger uptrend (wave 3 purple).
1 hour https://fxmedia.s3.amazonaws.com/art...10-2016uj1.png
The USD/JPY broke above resistance (dotted red) and seems to have started wave 3 (green/brown) unless price breaks below the support trend line (green). Price is expected to build a shallow wave 4 correction once wave 3 (green) has been completed.
Follow @ChrisSvorcik on twitter for latest market updates
EUR/USD
4 hour https://fxmedia.s3.amazonaws.com/art...10-2016eu4.png
The EUR/USD broke below the support (green) but price did now move far before a strong 4 hour bullish candle appeared. A bullish bounce could be possible despite the downtrend when considering the presence of divergence (purple lines) and the fact that price is still at a 61.8% Fibonacci level. A break above the resistance trend lines (light orange) could confirm the development of a wave d (green) on the daily chart, which is part of a larger weekly triangle.
1 hour https://fxmedia.s3.amazonaws.com/art...10-2016eu1.png
The EUR/USD seems to have completed a wave 4 and 5 within wave C (blue). The bullish momentum has been labelled as a wave A (purple) and the Fibonacci levels could be important if a bullish ABC zigzag (purple) indeed materializes.
GBP/USD
4 hour https://fxmedia.s3.amazonaws.com/art...10-2016gu4.png
The GBP/USD broke the support (dotted green) of the contracting triangle and indeed fell towards the next Fibonacci level of wave X (blue) which was the 78.6% Fib level. For the moment the bearish breakout seems to be part of a larger correction (WXY blue) rather than the restart of the downtrend.
1 hour https://fxmedia.s3.amazonaws.com/art...10-2016gu1.png
The GBP/USD is also showing the potential for an ABC zigzag (orange). At the moment the bullish momentum has been labelled a wave A (orange). A zigzag is invalidated if price breaks below the bottom of wave A (100% Fib of wave B vs A).
EUR/USD
4 hour https://fxmedia.s3.amazonaws.com/art...10-2016eu4.png
The EUR/USD made a bullish bounce despite the downtrend but was so far unable to break above the first resistance trend line (orange). A breakout above resistance could see price continue higher as part of wave e (green), which is a larger triangle on the daily and weekly charts. A breakout below support (green) could price fall towards the next Fibonacci support.
1 hour https://fxmedia.s3.amazonaws.com/art...10-2016eu1.png
The EUR/USD completed a bullish ABC zigzag as expected yesterday (blue). This is most likely part of a larger correction indicated by the WXY (purple). A breakout above resistance (orange) could price move towards Fib targets.
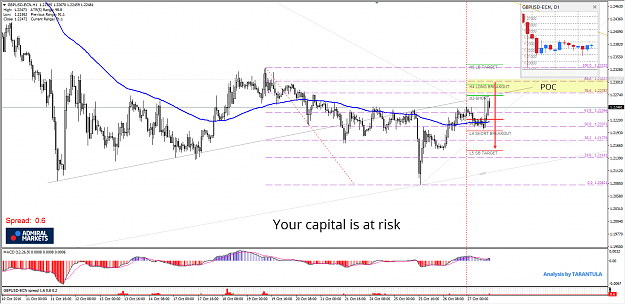
GBP/USD
4 hour https://fxmedia.s3.amazonaws.com/art...10-2016gu4.png
The GBP/USD showed a bullish bounce back to the resistance zone (orange), which seems to be part of a larger WXY (blue) correction.
1 hour https://fxmedia.s3.amazonaws.com/art...10-2016gu1.png
The GBP/USD completed an ABC zigzag (grey) as expected. A new bearish zigzag (grey) could take price back to the Fibonacci support levels of wave X (orange).
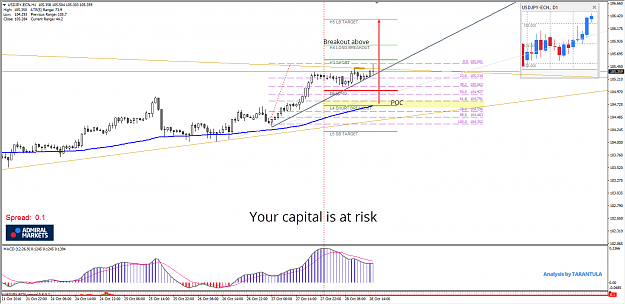
USD/JPY
4 hour https://fxmedia.s3.amazonaws.com/art...10-2016uj4.png
The USD/JPY broke multiple resistance levels (dotted lines), including a daily top. The chart is now confirming a higher high and is continuing with its uptrend.
1 hour https://fxmedia.s3.amazonaws.com/art...10-2016uj1.png
The USD/JPY could break above resistance (red) which would indicate a chance for price to continue with its uptrend momentum towards the Fibonacci targets. A bull flag pattern could develop at this point, which is expected to be part of a wave 4 (brown). In that case price is likely to go sideways or stay above the 50% (max 61.8%) Fibonacci levels of wave 4 vs 3.
Follow @ChrisSvorcik on twitter for latest market updates
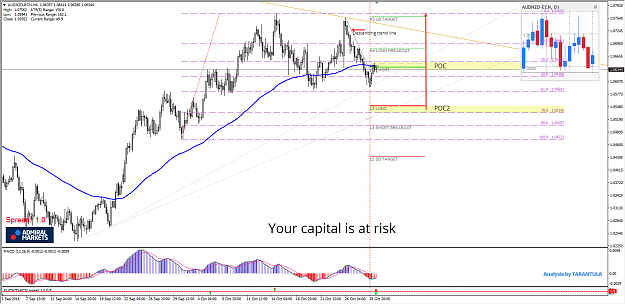
EUR/USD
4 hour https://fxmedia.s3.amazonaws.com/art...10-2016eu4.png
The EUR/USD broke above the triangle (dotted orange) and is expanding the bullish correction, which makes it more likely that a continuation of the daily triangle via wave d-e (green) is occurring. For the moment this correction has been labelled WXY (brown).
1 hour https://fxmedia.s3.amazonaws.com/art...-2016eu1-2.png
The EUR/USD breakout above resistance (red) has seen price move towards the Fib targets as part of a wave C (blue). At the moment a wave 3-4 (green) could still be taking place within wave C (blue) as long as price stays above the 61.8% Fibonacci retracement level and support trend line (green).
USD/JPY
4 hour https://fxmedia.s3.amazonaws.com/art...11-2016uj4.png
The USD/JPY uptrend saw a sturdy pullback last week but price is still above shallow Fibonacci levels of wave 4 (blue). A wave 4 correction (blue) seems likely as long as price stays above the 38.2%-50% Fib area.
1 hour https://fxmedia.s3.amazonaws.com/art...11-2016uj1.png
The USD/JPY could be building a larger correction within a wave 4 (blue) via an ABC (brown). A bullish bounce at the 38.2% Fibonacci level seems likely. If price does not make a deeper retracement to the 38.2% Fib, then I would expect a triangle formation (purple arrows) to emerge. A break above the top could also indicate a breakout.
Follow @ChrisSvorcik on twitter for latest market updates