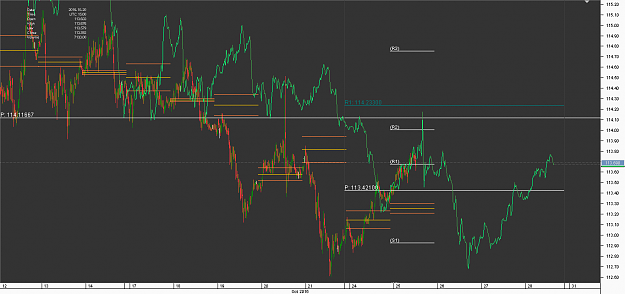
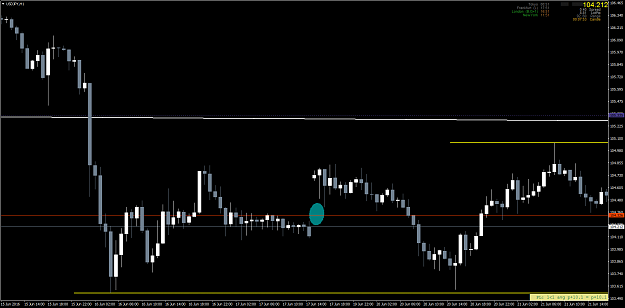
DislikedEUR USD For those who have IM me on EU Questions, I can only IM once every 24 hours as Commercial Member so below Chart is for you: The Horizontal lines on below 4 H EU chart is your Key areas of potential rejection or Failure. We see now we are at the key Area marked in yellow/current price for potential up swing if Bulls can defend. If they cant defend then the bears get paid all the way down to the Green line for fight on there {image}Ignored
 How to predict markets, Catch the moves at value
- #1,544
- Edited 8:23am Oct 24, 2016 7:41am | Edited 8:23am
- | Commercial User | Joined Aug 2016 | 4,132 Posts
- #1,548
- Edited 10:25pm Oct 24, 2016 10:29am | Edited 10:25pm
- | Commercial User | Joined Aug 2016 | 4,132 Posts
- #1,551
- Edited 11:35am Oct 24, 2016 11:10am | Edited 11:35am
- | Commercial User | Joined Aug 2016 | 4,132 Posts
- #1,552
- Edited 11:40am Oct 24, 2016 11:25am | Edited 11:40am
- | Commercial User | Joined Aug 2016 | 4,132 Posts
- #1,554
- Oct 24, 2016 7:01pm Oct 24, 2016 7:01pm
- Joined Mar 2012 | Status: Trader | 14,407 Posts
My Threads: Trading is as simple as 1-2-3, Highest Open / Lowest Open Trade
- #1,555
- Edited 10:29pm Oct 24, 2016 10:18pm | Edited 10:29pm
- | Commercial User | Joined Aug 2016 | 4,132 Posts