Disliked{quote} Steve hope you dont mind this video i think is valueable for lots to learn from about the market and candlesticks it helps when looking at daily or 5mins charts i think this may also help to answer what you were posting earlier too the lesson starts around 7mins so skip forwards https://youtu.be/eUGPLGQkIuYIgnored
Hi Jason,
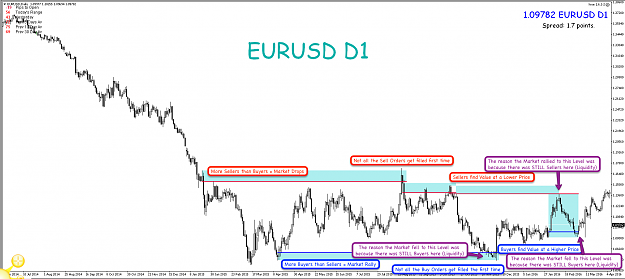
It's a good example of basic PA but he doesn't go into the reasons for the Market to move as it does.
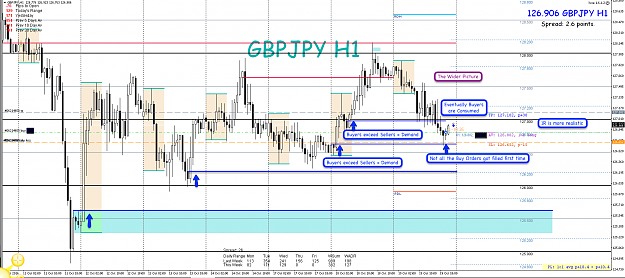
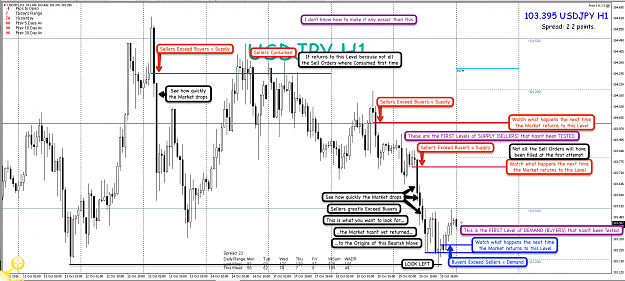
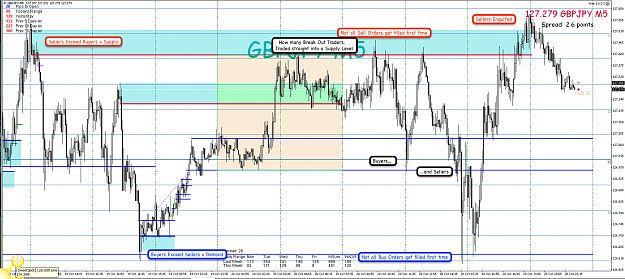
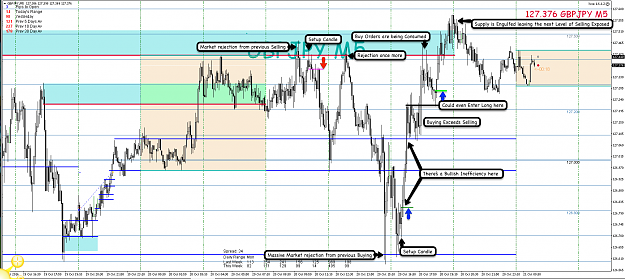
You need to also be aware of what has happened to the left.
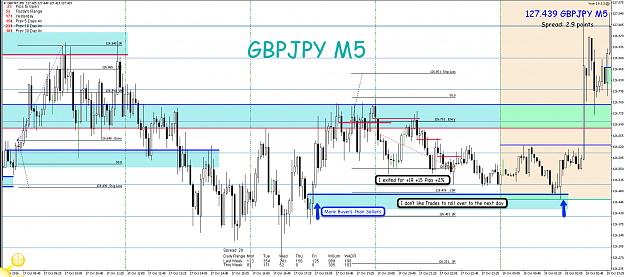
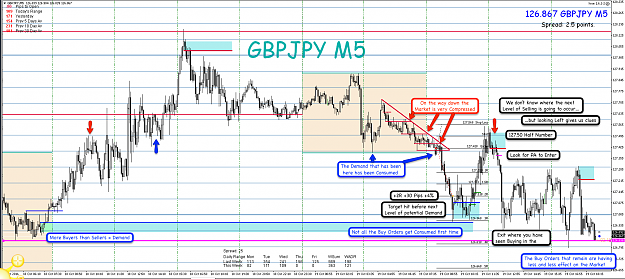
When we see Levels of Buying or Selling not all the Orders are Filled at the first visit the Market will always return to Liquidity.
Watch the video from about 20:40 to 35:50 and then look at the Chart below.
The weekly Range he is pointing out on W1 is nearly 600 pips.
Attached Image (click to enlarge)