Hello ,
it's a long time that I do not write on a forum in the meantime I studied a lot everything related to machine learning and data mining.
I write this thread to ask an explanation about the strange correlations that I found on EURUSD (against other currencies will have similar values). I explain briefly what I did:
I have calculated the first differences between the high, low, close, open; for example assuming to take into account the 3 subsequent high as for example 1.3000 --- 1.3050 1.3020 ----- the first differences are 0, 0050 and -0.0030
I calculated the correlation - https://en.wikipedia.org/wiki/Correl...and_dependence - considering different lag values values (for simplicity here are reported only lag 1, that represents the correlation of the first differences between current and old values . Through this calculation I found some high correlation values:
This means taking as an example the first row that High at time t is very high correlated with close at time t-1, medium correlation with low at time t-1 and low correlation with high at time t-1. For close you can see that it is virtually uncorrelated with the past.
As for High / Low values seem strangely high, moreover this would imply that the prediction of the sign is possible for high and low while the close is practically impossible (see line diff_close).
These values are calculated by taking into account different time periods (typically annual) values taken from 1h chart, but the same values can be founded on different timeframe and even on different currencies.
I wanted to know if anyone can explain these so high values for high/low and in the future maybe hypothesize a practical application.
Thank you,
Andrea182
it's a long time that I do not write on a forum in the meantime I studied a lot everything related to machine learning and data mining.
I write this thread to ask an explanation about the strange correlations that I found on EURUSD (against other currencies will have similar values). I explain briefly what I did:
I have calculated the first differences between the high, low, close, open; for example assuming to take into account the 3 subsequent high as for example 1.3000 --- 1.3050 1.3020 ----- the first differences are 0, 0050 and -0.0030
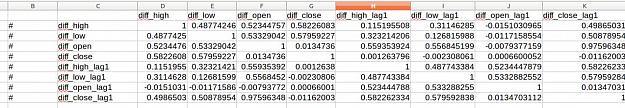
I calculated the correlation - https://en.wikipedia.org/wiki/Correl...and_dependence - considering different lag values values (for simplicity here are reported only lag 1, that represents the correlation of the first differences between current and old values . Through this calculation I found some high correlation values:
Attached Image (click to enlarge)
This means taking as an example the first row that High at time t is very high correlated with close at time t-1, medium correlation with low at time t-1 and low correlation with high at time t-1. For close you can see that it is virtually uncorrelated with the past.
As for High / Low values seem strangely high, moreover this would imply that the prediction of the sign is possible for high and low while the close is practically impossible (see line diff_close).
These values are calculated by taking into account different time periods (typically annual) values taken from 1h chart, but the same values can be founded on different timeframe and even on different currencies.
I wanted to know if anyone can explain these so high values for high/low and in the future maybe hypothesize a practical application.
Thank you,
Andrea182