Joined Mar 2009
|
Status: Hobby Trader
|4,477 Posts
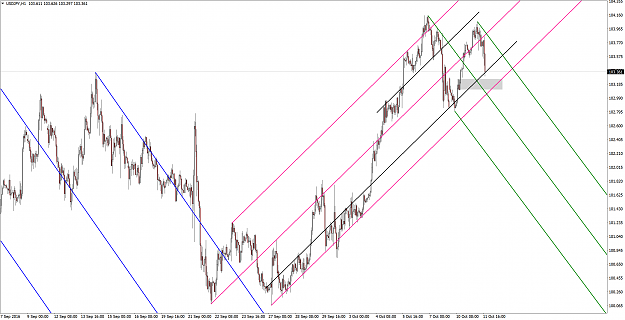
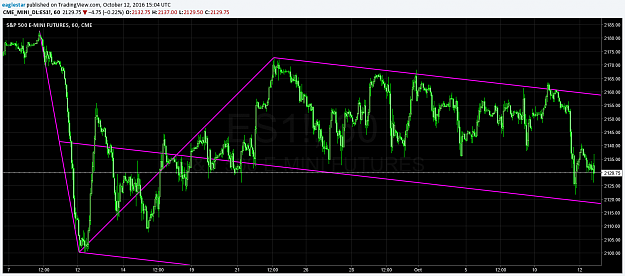
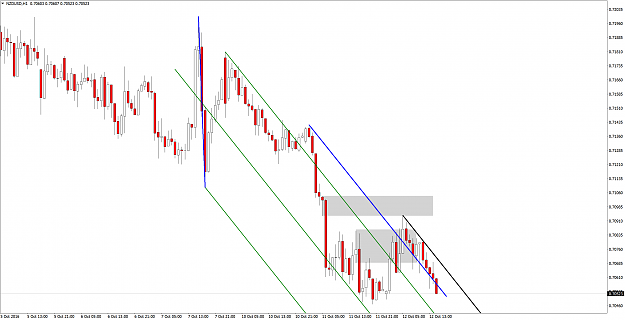
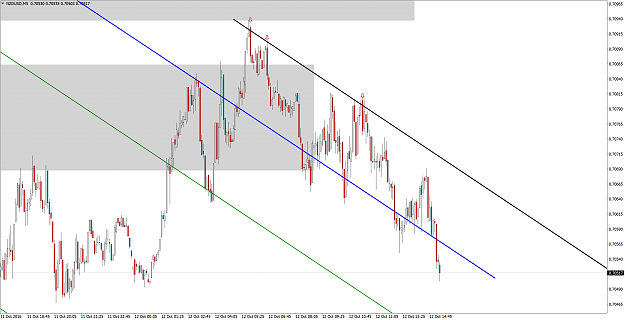
USDJPY H1 finally coming back to test diagonal uptrending support. I favor an entry around the grey rectangle. However liquidity is gonna start to drop off.
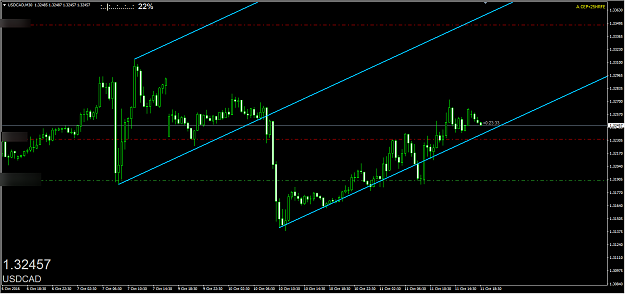
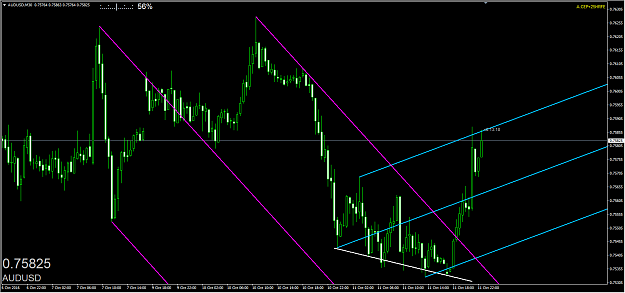
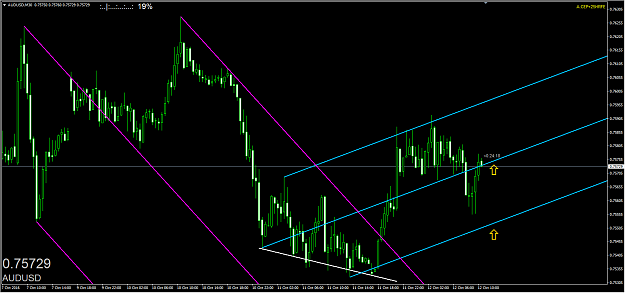
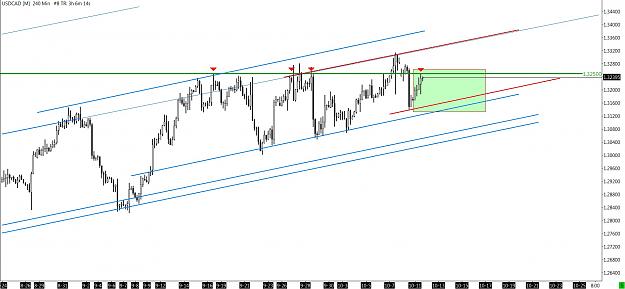
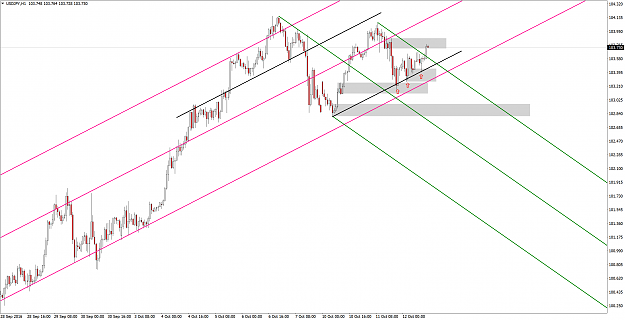
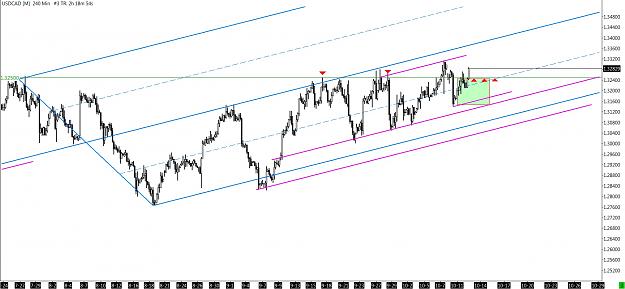
Watching USDCAD. In a potential wedge in the green box, price at 1.3250 horizontal yet again. Time to be patient and see how this plays out, we do not wanna get ground up in a wedge, that'll just give you a headache.
Watching the red lines top and bottom. Bottom red has potential to be support but we have to see it reject, it's just a line for now, meaningless until proven. Top line could be good. Compare earlier DXY chart to this, see the difference in momentum? Interesting huh?
Attached Image (click to enlarge)
If you're not in the 5% yet it's because you have to try 95% harder.
Thanks for those charts eagle. Mapping progression of price like that puts you in the driving seat! Really good explanation & examples. One for the famly album!
If you're not in the 5% yet it's because you have to try 95% harder.
Watching USDCAD. In a potential wedge in the green box, price at 1.3250 horizontal yet again. Time to be patient and see how this plays out, we do not wanna get ground up in a wedge, that'll just give you a headache. Watching the red lines top and bottom. Bottom red has potential to be support but we have to see it reject, it's just a line for now, meaningless until proven. Top line could be good. Compare earlier DXY chart to this, see the difference in momentum? Interesting huh? {image}
Ignored
Great minds think alike. Thanks for the heads up on the longer timeframe.
Attached Image (click to enlarge)
The things that we love tell us what we are Thanks Redsword11 and Tim Morge
USDJPY H1 finally coming back to test diagonal uptrending support. I favor an entry around the grey rectangle. However liquidity is gonna start to drop off. {image}
Ignored
Price ran out of steam at the median line, dropped lower, now price is bouncing from resistance
Attached Image (click to enlarge)
The things that we love tell us what we are Thanks Redsword11 and Tim Morge
{quote} This is my H1 NZDUSD chart. Assuming the fork is correct the red arrow is an area where one might have sold. If so why or why not? No wrong or right answers because I don't know either. Just want some input on entries. Hope everyone responds. Thanks! {image}
Ignored
Just realized this fork is incorrectly drawn. Sorry
You were close to the bottom there, but what does the chart show now? We must be fluid and read price action as it happens and use the forks as a guide to trade the price action. I don't usually trade multiple time frame these days but the 1hr is also shown as you posted the 1hr chart
Attached Image(s) (click to enlarge)
The things that we love tell us what we are Thanks Redsword11 and Tim Morge
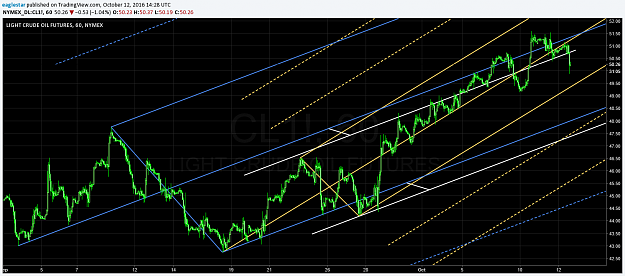
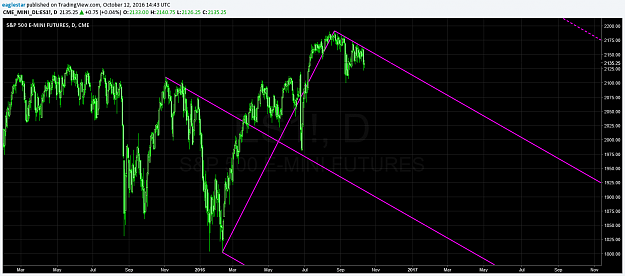
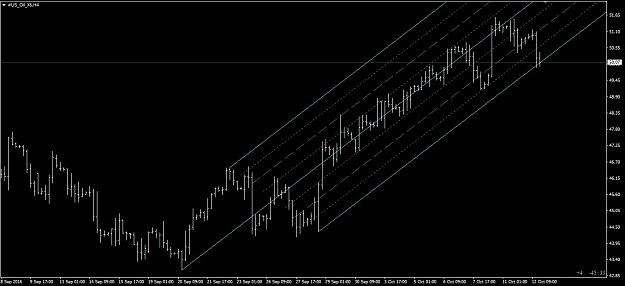
Watching WTI Crude at these levels. Could get interesting. Even if you never trade it, it has implications for CAD, JPY and USD so always worth watching. When oil is in the news, and the news is bullish, it can send USDCAD lower and USDJPY higher. On the face of it, you might wonder why one inverse USD pair is weakening whilst the other is strengthening. Canada is net exporter, and Japan net importer of the black stuff. Opposite ends of the supply demand see-saw.
(Remember though, with correlations YMMV.)
Notice the angle of the up forks is almost exactly the same? Markets aren't always 'mysterious'.
Attached Image (click to enlarge)
This example is also a good demonstration of how to clear up the confusion over which fork to use (Andrews, Schiff or Modified Schiff). I like that, in the chart above, the most recent up fork has a test of the median line, and also has found support at the lower parallel line. This is an Andrews fork.
In this chart (below) however, we can see that a Modified Schiff might ALSO be valid. Especially when we consider that a trend line might be forming at the angle of the lower purple trendline.
Attached Image (click to enlarge)
How to know which one to use? Sometimes we just have to sit tight and wait for more data and see which of the two gets respected, i.e, do we get bounces at median lines, parallels or sliding parallels related to EITHER the Andrews or the Modified Schiff. Time will tell, patience patience patience.
Oil might also suddenly drop out of this area very quickly, rendering both up forks, Andrews or Modified Schiff, useless and meaning we have to look for something pointing down instead. The forks are a great tool, but don't be married to them - just like trades, don't be married to them, if you are wrong, you are wrong, so just be prepared to be flexible and approach with an open mind - anything could happen, you don't have to PREDICT, just REACT to the right signals.
But doesn't the sound of not having to PREDICT price already sound like a load off your mind? Well then wait for the clues instead, and until you get them, don't worry if it's 'oh, this is going up' or 'it has to go down'. That's how you lose your shirt going long GBPUSD. We don't care. We're not trying to impress anyone with our AMAZING! insight, we're just here to do a job, and not mess around. And that job is to find areas where we expect price to react. If we see the reaction we want, we act. If we don't, well, we don't. That's it.
If you are doing anything outside of this - like 'oh, I think this might go up here because I have a feeling that...' then you are not trading in a sustainable way. You CANNOT make a career out of this by having 'feelings'. Having 'feelings' is not something you can repeat over and over, day in, day out, and expect to be right.... Plus your mind will just cave in with fear and anxiety and you'll be on the edge of your nerves all of the time. Not a good way to live (ask me how I know ).
And finally, know that when you sit down to work, KNOW that you might have to redraw stuff over and over. This might go on for days. And you still might get a loss at the end of it. You get paid based on how well you can deal with frusration and waiting, DO NOT let it get to you, and just wait. The best trades always feel effortless, and are worth waiting for, just to experience that feeling. Focus on becoming an expert at dealing with frustration.
Learn as quickly as you can to be an expert frustration handler. Rise above it, let the other guy get frustrated, then take his money. Meditate, exercise, learn breathing techniques, whatever it takes to become a master of dealing with frustration, start doing it today, Expert Frustration Manager - it's your new job title, congratulations, don't mess it up or you're fired!
ANYONE can trade if they know what to look for (and price action isn't hard, engulfs, pin bars, pullbacks etc, you already KNOW this stuff guys), and they can have patience and handle frustration. You can make a career out of drawing a trendline using two points and seeing if you get a bounce at the third touch and locking in some profit early. You can do this on hourly up to monthly, if you are prepared to wait.
Good luck out there guys. Hope this helps. Trust me, I have to remind myself of this constantly too! I'm not special at all, I have nothing that you can't learn to do.
If you're not in the 5% yet it's because you have to try 95% harder.
USDJPY H1 finally coming back to test diagonal uptrending support. I favor an entry around the grey rectangle. However liquidity is gonna start to drop off. {image}
Ignored
The rectangle I spoke of yesterday held. The parallel also worked well although PA moved up rather messily. I confess I used the 5 minute for "paper" entries as I did not trade this live. Just workin with it.
Keep up the good work Winston, love your charts dude. In line with what I am seeing on longer timeframes. She sure is dropping!
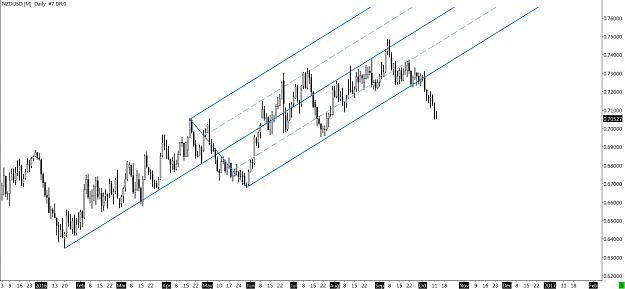
NZDUSD Daily. The fork failure that showed the start of the downmove:
Attached Image (click to enlarge)
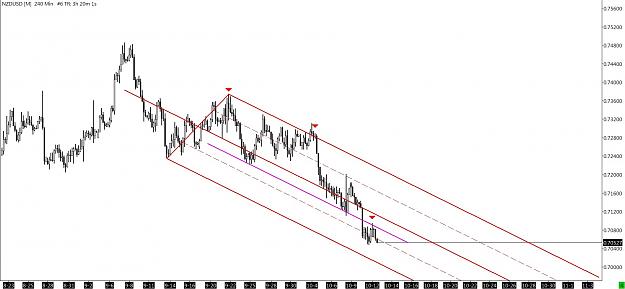
NZDUSD 4H. I'd love to see a re-test and rejection of the lower sliding parallel, though it looks like it might be gunning straight for the bottom parallel and maybe beyond - makes your entries even more epic Winston! 40+ pip moves off a 5 min chart. Very nice Sir. I guess we'll see:
Attached Image (click to enlarge)
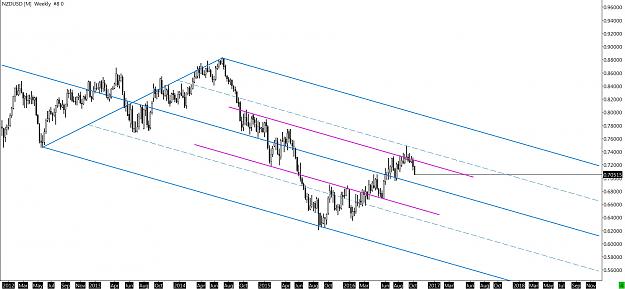
NZDUSD Weekly. We might just be getting started on a big downtrend here:
Attached Image (click to enlarge)
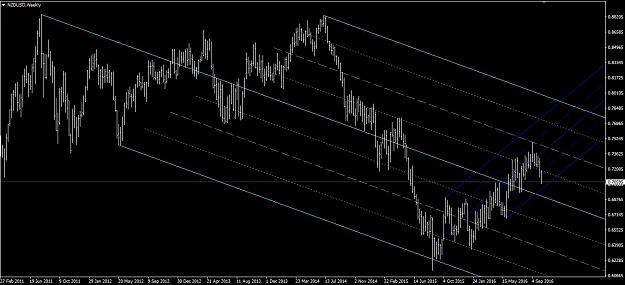
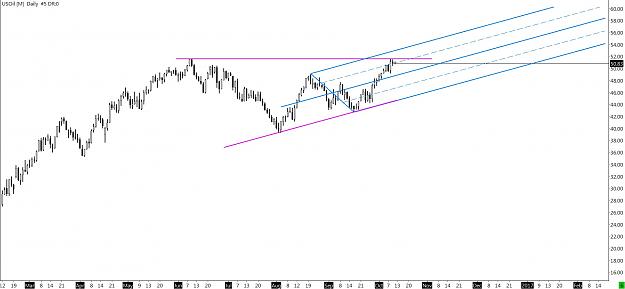
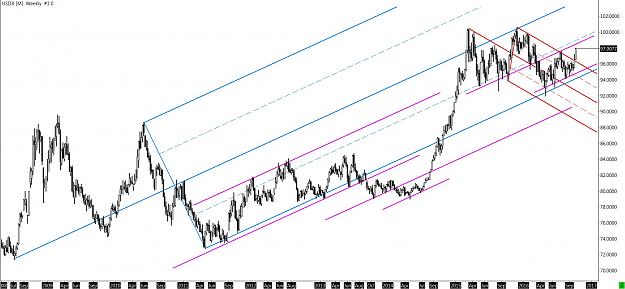
DXY (USDX) Weekly. Flying!:
Attached Image (click to enlarge)
(Btw, I'm gonna keep the forks on my charts when I post them, it occured to me that it's easier to understand using the angles if I leave them on, though on my own charts I often hide them to tidy things up if there are too many lines already! Blues are up, reds are down)
If you're not in the 5% yet it's because you have to try 95% harder.
Yes, it is me. Thanks for the kind words. I plan to start participating. I have a question: What belongs in this thread vs. the Andrews Pitchfork (Median Line) thread?
--chan
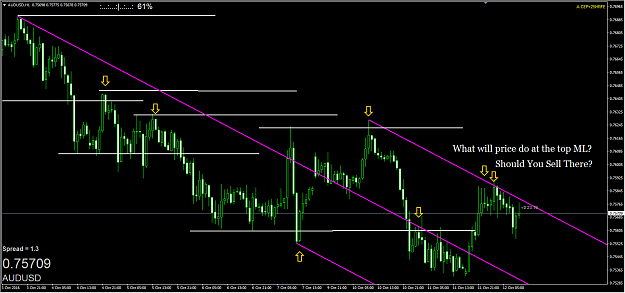
USDCAD 4H. Looks like we got our answer to this wedge question, but not confirmed yet. Wondering if we get support at that pesky 1.32500 line now, though we have to be a bit careful because longs might run into resistance (note to self: take some off the table quickly, dummy!) It didn't hold above here on previous high, so I'm cautious:
Attached Image (click to enlarge)
Be nice if it did go higher though. I set one of those FF outlook sentiment things in my profile for this pair to bullish in July, so would be nice not to have egg on my face! But as I said in my rant earlier, the prediction game isn't important to us, we're traders not Hedge Fund Rock Stars. (That's my excuse and I'm sticking to it! )
If you're not in the 5% yet it's because you have to try 95% harder.
Watching WTI Crude at these levels. Could get interesting. Even if you never trade it, it has implications for CAD, JPY and USD so always worth watching. When oil is in the news, and the news is bullish, it can send USDCAD lower and USDJPY higher. On the face of it, you might wonder why one inverse USD pair is weakening whilst the other is strengthening. Canada is net exporter, and Japan net importer of the black stuff. Opposite ends of the supply demand see-saw. (Remember though, with correlations YMMV.) Notice the angle of the up forks is almost...
Ignored
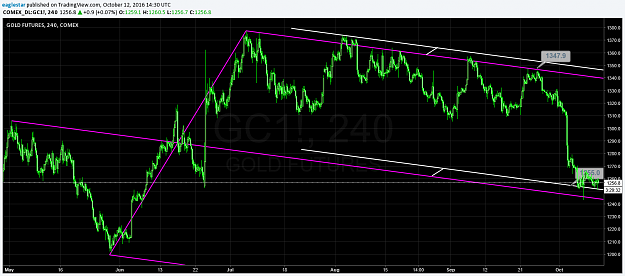
Excellent post. Here are a couple of charts... Gold ES Crude Oil
Oil is following 2 fork frequencies
{quote} You were close to the bottom there, but what does the chart show now? We must be fluid and read price action as it happens and use the forks as a guide to trade the price action. I don't usually trade multiple time frame these days but the 1hr is also shown as you posted the 1hr chart {image} {image} {image}
Ignored
Follow Up...On 1h chart price retraced off of the upper down sloping ML. On 30min chart price retraced from uper 30min new fork.
Attached Image(s) (click to enlarge)
The things that we love tell us what we are Thanks Redsword11 and Tim Morge
Eaglestar: love the charts, but in particular the Gold futs - I really like the way you can see the subtle lowering of price against upper resistance each time it tests it before that mammoth drop (240 M). First it is held by the upper sliding parallel, then it it is held by the fork itself, then it struggles to get near the top of the fork. Really clues you into what might be about to happen - then sure enough *CRUNCH*. Lovely. Catching those ones might be the only trade you have to make all month!
If you're not in the 5% yet it's because you have to try 95% harder.
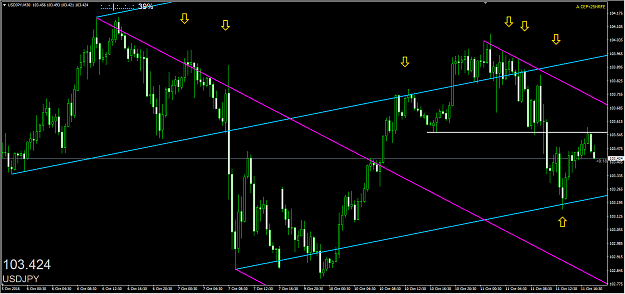
Exactly what I was saying about frustration before. I missed this Yen trade entry this morning and just had a bit of a swear. But now I know what it's doing, so it's still worth something to me. Patience. No chasing just because I missed it.
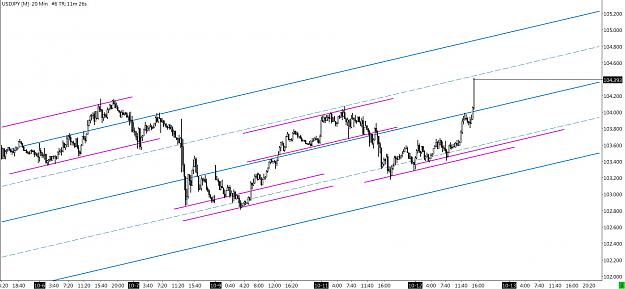
USDJPY20MIN
Attached Image (click to enlarge)
(Incase anyone is wondering because I post longer timeframe charts, I do watch the 20MIN for entry, but I don't make trading decisions from it, if you see what I mean. See how support is stepping up, just like Gold was stepping down in Eaglestar's Gold chart. You get support at the purple parallel, you get a bounce slightly higher, this holds for a second time giving you confidence that buyers are coming in sooner to snap those bargains up. Boom. What a beauty! Probably going to get some resistance here, so for a nice quick trade I would be taking the money and running.)
If you're not in the 5% yet it's because you have to try 95% harder.