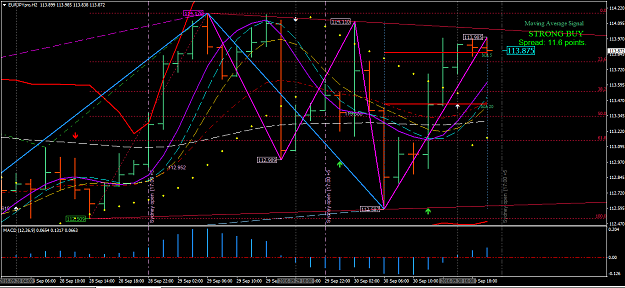
Ok I uploaded metatrader4 on forex.com and opened demo account. Now my chart looks like your chart eflaco. I didnt understand why my spread 11.6 points? Maybe market close on saturday. I hope monday it will be 2.5 points
Attached Image (click to enlarge)