Crude prices slumped on Wednesday as investor worries were reignited over no agreement being reached regarding an output cap or a new output ceiling between oil producers at the informal meeting between major producers in Algiers, that ends later today. News that Iran rejected an offer from Saudi Arabia to limit its oil output in exchange for Riyadh cutting supply outweighed data from API which showed a surprise draw-down in U.S. crude stocks.
The American Petroleum Institute reported that crude oil stocks dropped by 752,000 barrels in the week ended Sept. 23rd, to 506.4 million barrels, compared to analyst estimates for a 2.8 million-barrel build.
In an interview at his bank's headquarters on Tuesday, San Francisco Federal Reserve Bank President John Williams stated that the Fed can raise interest rates without restraining the U.S. economic recovery, and that the central bank risks causing more harm by keeping rates too low for too long. "There are risks to pushing things too far”, he said.
In its monthly report on Tuesday, market research group the Conference Board indicated that U.S. consumer confidence unexpectedly jumped in September to a more than nine-year high. The gauge of consumer confidence surprisingly increased to 104.1 this month from a reading of 101.8 in August. This month’s reading was its highest level since August 2007.
Meanwhile, China's economy is expected to grow at an annual pace of 6.6 percent in the fourth quarter this year, the China Academy of Social Sciences (CASS) said. CASS also forecast an overall growth of 6.7 percent for the full year, which was in line with the government's own full-year forecasts of 6.5-7 percent growth.
Technicals
EURUSD
Fig: EURUSD H4 Technical Chart
EURUSD fell off from over one-week highs at 1.12785 and is sliding back towards the 23.6% Fibonacci retracement level at 1.11891. As can be seen from the price chart, the price has broken out of the recently formed ascending trading range and at the same time moved past the MA50. The support at the 23.6% level is within sight but is much likely to be broken through, especially with a market that has already entered the bearish territory.
Trade suggestion
Sell Stop at 1.11890, Take profit at 1.11500, Stop loss at 1.12200
USDCAD
Fig: USDCAD H4 Technical Chart
USDCAD has been swinging between gains and losses around the major level 1.32000 since the start of this week. In general, the USDCAD market remains in a bullish setup with the RSI currently above the 50 line while the two moving averages are placed below the price action and supporting the up moves.
Trade suggestion
Buy Stop at 1.32200, Take profit 1.32800, Stop loss at 1.31400
GBPAUD
Fig: GBPAUD H4 Technical Chart
The British Pound is steadily losing ground again the Australian dollar but the pace of declines is becoming slower. However, sellers are expected to continue to overwhelm the market as the stochastic chart has not shown any sign of a pullback yet. Both MA's are placed above the price action which is creating further overhead pressure for the market. In the event of a continual downfall, the support at 1.68700 is within the sight and likely to be tested.
Trade suggestion
Sell Stop at 1.69300, Take profit at 1.68700, Stop loss at 1.70000
WTI
Fig: WTI H4 Technical Chart
U.S light, sweet crude has been swinging back and forth between the support at 44.50 and the resistance created by the trendline connecting higher highs since August 19. The price bounced back again after hitting the support line but is heading downwards back to this handle and is expected to make a breakout as the two MAs have converged above the price action. The Relative Strength Index which is below 50 also confirmed a bearish tone in the market.
Trade suggestion
Sell Stop at 44.50, Take profit at 43.85, Stop loss at 45.10
SILVER
Fig: SILVER H4 Technical Chart
Silver seems to be completing the double top pattern after reversing lower from the two-week high at 20.046. The price is around the neck level and may fall deeper as the short-term MA20 has penetrated the long-term MA50 from above. Additionally, ADX has soared higher to a level of 39.22, suggesting further declines.
Trade suggestion
Sell Stop at 19.960, Take profit 18.765, Stop loss at 19.265.
NASDAQ
Fig: NASDAQ H4 Technical Chart
In general, the Nasdaq 100 index has been in an uptrend. The price has never fallen below the short-term MA20 or the long-term MA50 since mid-September, and is heading for the record high at 4894.81 created last Thursday. The index is anticipated to retest this level but it still seems uncertain whether the price can set a new record as the market has remained close to or within the overbought territory. A pullback may be expected.
Trade suggestion
Buy Stop at 4875.00, Take profit at 4894.81, Stop loss at 4840.00
Golden “Rio” Quarter For Nike But Future Orders Disappoint – Selling Favourable
Shares of Nike Inc. dropped in the after-hours trading session on Tuesday after the world’s largest athletic gear maker reported earnings and revenues that topped forecasts coupled with a slowdown in future orders growth.
The Rio Summer Olympics helped give Nike’s sales a boost. The company reported that sales for the fiscal first quarter rose 7.7% to $9.06 billion, beating the average analyst estimate of $8.87 billion. Nike’s earnings climbed 5.9% to 73 cents a share, outshining Wall Street’s forecast of 56 cents a share.
However, future orders for delivery in the period from September 2016 through January 2017 rose at a disappointing pace of 5% to $12.3 billion, falling behind the figures from the same period a year ago. Future orders for the same period last year had registered a 9% rate of growth. Meanwhile, inventories jumped 11 percent from the year-ago period to $4.9 billion in the three months ended Aug. 31.
Nike finance chief Andy Campion said on Tuesday that Nike would no longer report future orders in its quarterly earnings news releases, as the athletic apparel company is aiming to sell those products directly to consumers, instead of sellling through wholesale partners.
Nike recorded consistent sales growth across the board, with double-digit gains in foreign markets including China, Japan and Western Europe. Nonetheless, sales in North America, which comprises the lion’s share of Nike’s business, were only up 6%, due to increasing competition from rivals Under Armour Inc. and Adidas AG. Both companies are grabbing market share from Nike in crucial categories such as basketball and casual footwear.
Technical Analysis
Nike has rebounded to trade above the 23.6% retracement level at 55.25. But a downfall in after-market trading may create a big gap down on the market open today and depress the price back below this level. The next support at 53.10 is within sight and may be tested. The market setup currently looks bearish as the RSI has dropped below 50 and is headed towards the oversold territory, while the price action has broken through both MA’s from above and both MA’s placed overhead are exerting downward pressure.
Trade suggestion Sell Stop at 53.76, Take profit at 53.10, Stop loss at 54.75
Paychex’s Shares To Rise On Shining Quarterly Report – Long Positions Seem Profitable
Paychex, Inc. announced better-than-expected results for the fiscal first quarter before the market open on Wednesday. The New-York based company reported total service revenue of $785.5 million for the three months ended August 31. That was up 8.6% from $712.2 million revenue reported for the same period last year.
Net income was reported to have increased by 4% to $217.4 million, or $0.60 per share, up from $209.1 million, or $0.58 per share, in last year’s first quarter. “Net income and diluted earnings per share were impacted by changes in the effective income tax rate resulting from discrete tax items recognized in the first quarter and respective period last year”, the report said.
Martin Mucci, President and Chief Executive Officer, commented that “We experienced growth across all of our major human capital management product lines”.
Trade suggestion Buy Stop at 58.24, take profit at 60.36, stop loss at 56.00
Asian shares rallied on Thursday, taking their cue from the Wall Street overnight that finished higher after OPEC members reached an agreement on a production-limiting deal. The Dow Jones rose 0.61 percent, to 18,339.24, the S&P 500 gained 0.53 percent, to 2,171.37 and the Nasdaq Composite added 0.24 percent, to 5,318.55.
Stocks were boosted by surging oil prices following an unexpectedly decision by major oil producers to cut crude production for the first time since 2008. Crude production will possibly be curbed by about 750,000 barrels per day. The details over country-by-country production is to be decided at the next formal OPEC meeting in November.
The news came after the U.S. Department of Energy's Energy Information Administrations data showed that U.S. crude stocks lost 1.9 million barrels to 502.7 million barrels in the week to Sept. 23. Inventories had been expected to rebound after the big drop in previous weeks. However, the EIA continued to surprise the market by reporting unexpected supply declines for four weeks in a row.
Elsewhere, data from the Ministry of Economy, Trade and Industry on Thursday indicated that Japan's retail sales fell more than expected in August. Japanese retail sales retreated by 2.1 percent in August from a year earlier, due to a stronger Yen and slow wage growth that discouraged spending on clothes and home appliances. The figures have shown worse results than forecast for the sixth straight month, casting pressure on policymakers to find ways of beefing up household spending.
Technicals USDCAD
Fig: USDCAD H4 Technical Chart
Having falling more than 220 pips from the peak in the last six months, USDCAD bounced back as bear has exhausted after sending market into oversold state. Since the start of September, the pair had been in an uptrend, forming higher highs and higher lows, combined with turning the resistance at 1.31400 into a firm support. USD, however, fell back under this level yesterday and is expected to extend the downfall to the 23.6% retracement at 1.29857.
Trade suggestion
Sell Stop at 1.30500, Take profit at 1.30000, Stop loss at 1.31000
USDJPY
Fig: USDJPY H4 Technical Chart
USD has breached the near-term resistance at 101.200 versus the JPY. The pair also moved past the 50-period moving average at 101.050, confirming the uptrend after it broke above the MA20. However, the upside seems limited as the downtrend line that has connected lower highs is within the sight.
Trade suggestion
Sell Limit at 101.950, Take profit at 101.200, Stop loss at 102.740
USDNOK
Fig: USDNOK H4 Technical Chart
The Norwegian Krone has escaped from the range between 8.09000 and 8.15000, and hit nearly five-month highs at around 8.01771. However, the pair is being held around this level as it has fallen into another consolidation period. As can be seen from the RSI indicator chart, USDNOK is trading in the oversold territory. That helps explain current corrective moves. The pair is expected to extend the slide then.
Trade suggestion
Sell Stop at 8.01770, Take profit at 7.96900, Stop loss at 8.06500
BRENT
Fig: BRENT H4 Technical Chart
Brent has been retreating from the highest level in three weeks at 49.07. The price reversed lower as a result of profit-taking after the market had been overblown and entered the overbought zone. Furthermore, the downward trendline connecting lower lows since August 19 also acted as a firm resistance. Nonetheless, this handle is much likely to be broken through as MAs and parabolic sar band placed below the action are supporting upbeat moves.
Trade suggestion
Buy Limit at 48.20, Take profit at 49.35, Stop loss at 47.80
WHEAT
Fig: WHEAT H4 Technical Chart
Wheat futures contract resumed the rally today, following a retreat on Wednesday. The price action has been twisted with the moving averages, showing a period of sideways generally. As the short-term MA has converged with the long-term MA, and the RSI index is pointing upwards from 50 threshold, the commodity may re-attempt one week high at 410.10.
Trade suggestion
Buy Stop at 407.00, Take profit at 410.00, Stop loss at 405.00
DAX
Fig: DAX H4 Technical Chart
German DAX 30 index has been paring all of its losses in the last one week and heading upwards to two-week highs around 10700.00 recorded last Thursday. From near oversold zone, the DAX market has entered bullish territory with RSI surpassing the 50 line. Besides, ADX index that has soared to 26.36, coupled with the wide gap between the +DI and DI lines, consolidated prolonged rally.
Trade suggestion
Buy Stop at 10600.00, Take profit at 10700.00, Stop loss at 10520.00 https://capitalstreetfx.com/en/wp-co...ort_footer.jpg
Crude oil soared more than 5% overnight following news that the Organization of the Petroleum Exporting Countries had reached a preliminary accord to reduce production. However, oil prices fell on Thursday as scepticism over the effectiveness of the deal led to profit taking.
Oil jumped to a three-week high after OPEC members surprisingly agreed to curb output by between 200,000 – 700,000 barrels a day. Given the current output at around 33.24 million bpd, the new production celling would be within the range of 32.5-33.0 million bpd. This was the first time since 2008 that the cartel reached an output freeze agreement and could re-establish an output ceiling mechanism abandoned a year ago.
This time, OPEC has chosen to defend market prices instead of market share as the 14-member bloc has done in the last two years, which reflects serious consequences that low crude prices have caused to heavily oil-dependent economies.
However, details of the deal, including the specific quota for each member, cannot be finalized until the formal meeting of OPEC members on November 30th, when OPEC also tends to invite non-OPEC oil producers such as Russia to join discussions over production and supply matters.
Investors are questioning if this agreement could arrest the glut in the already over-supplied market, considering the fact that higher prices will attract U.S shale oil producers to come back into the market.
The U.S. Energy Information Administration has reported unexpected supply declines for four weeks in a row. Official data on Wednesday reported that U.S. crude stocks declined by 1.9 million barrels to 502.7 million barrels in the week to Sept. 23. This comes against expectations that inventories would rebound in the current week, after big drops in previous weeks.
Technical Analysis
WTI once again had to give up its strength at the resistance level of 47.45. In the last month, we have seen the price reverse lower when it has come up against this zone at least 3 times. Looking back at previous cycles, we can see that every pullback from the resistance at 47.45 has resulted in a reversal into a downtrend. However, given current bearish candles with long lower shadows, we can see that buyers are preventing prices from falling deeper. Hence, the slide we are seeing can be considered as a correction and the near-term support could be at 46.50.
Trade suggestion Buy Limit at 46.50, Stop loss at 46.00, Take profit at 47.45
Pharmaceuticals major Merck led decliners today, down more than 2% so far. Merck, Mylan and other drug companies are facing scrutiny over increases in product prices.
A group of senators asked the Department of Justice to investigate the case of the drugmaker Mylan. The company is suspected of having broken the law when it classified its emergency allergy shot EpiPen as a generic drug, which allowed Mylan to make lower rebate payments to states.
Meanwhile, Caterpillar, the heavy equipment provider and supplier that also provides equipment for the oil industry, topped risers today, after oil prices surged following the deal between Oil producing countries overnight.
Trade suggestion Sell Stop at 18180.00, Take profit at 18130.00, Stop loss at 18215.00
Global stocks tumbled on the last trading day of September, denting quarterly gains as bank stocks led losses on worries over Germany's largest lender Deutsche Bank. Most Asian indexes receded while European benchmarks opened lower on Friday.
Deutsche Bank shares hit a new record low, shedding nearly 7% following news that about 10 hedge funds doing business with Deutsche Bank have moved part of their listed derivatives holdings to other firms this week. Those are among the biggest clients of the bank, including Izzy Englander’s $34 billion Millennium Partners, and the $14 billion Capula Investment Management.
According to data released by the Federal Statistical Office Destatis, on Friday, German retail sales, adjusted for inflation and seasonal swings, slipped by 0.4% in August from the previous month. However, sales volume adjusted for inflation were still sharply higher than in August 2015 thanks to an extra day of sale.
The U.S. economy expanded at a 1.4 percent annualized rate in the second quarter, compared with a prior estimate of 1.1 percent, Commerce Department figures showed on Thursday. The U.S gross domestic product rose by more than the 1.1% growth rate expected. GDP growth was helped by household consumption which made up for tepid business investment and lackluster demand from overseas. Consumer spending is expected to continue to drive growth in the third quarter, considering recently robust hiring and nascent wage gains.
Technicals
AUDUSD
Fig: AUDUSD H4 Technical Chart
AUDUSD has fallen out of the support at 0.76140 which coincides with the 23.6% retracement level. The pair has broken below the long-term MA50, which suggests further down moves after the short-term MA20 had been crossed over. Long lower shadows in the current and recent candles show that buyers are buying dips, but this bullish force is anticipated to weaken once the pair hits the 23.6% level again.
Trade suggestion
Sell Limit at 0.76140, Take profit at 0.75650, Stop loss at 0.76400
EURUSD
Fig: EURUSD H4 Technical Chart
Euro fell to a one-week trough against the USD. The pair lost more than 50 pips from the resistance at 1.12200, after a period of time swinging back and forth around this level. The steep decline brought the currency pair below the 38.2% retracement level at 1.11891. The break lower continues to keep the market in bearish territory, as the price action has broken below both the MA's which are now placed above the price action.
Trade suggestion
Sell Stop at 1.11750, Take profit at 1.11500, Stop loss at 1.12000
EURCAD
Fig: EURCAD H4 Technical Chart
EURCAD resumed its downtrend after failing at the resistance zone marked by the two moving averages near the 1.47500 level. Long upper shadows of the recent candles indicate a strong bearish force that has restrained the pair from surging higher. Since RSI is below 50, sellers are foreseen to continue to drive the market lower. The near-term target is at the 23.6% support at 1.46334.
Trade suggestion
Sell Stop at 1.47050, Take profit at 1.46334, Stop loss at 1.47800
SILVER
Fig: SILVER H4 Technical Chart
Silver bounced back from the support at 18.960 again. After having moved past the 20-period MA, the metal is up against the next level of resistance that is the 50-period moving average at 19.265 , which may be a tough zone to break through. As can be seen from the stochastics, both %K line and %D line have surpassed the average level and are heading upwards. A breakout beyond the 23.6% level is expected.
Trade suggestion
Buy Stop at 19.370, Take profit at 19.630, Stop loss at 19.000
Natural gas
Fig: Natural gas H4 Technical Chart
Natural gas bounced back from the major support level at 2.935 after dropping more than 7% from the highest at 3.163 since mid-May, 2015. The steady downtrend has sent the market into the oversold zone which has led to some corrective moves. With the MA20 penetrating the MA50 from above, the commodity is expected to resume its slide and break below the current support zone.
Trade suggestion
Sell Stop at 2.930, Take profit at 2.875, Stop loss at 3.000
FTSE
Fig: FTSE H4 Technical Chart
U.K’s FTSE 100 index created a small gap down on the open today and slid to as low as 6810.00 before rebounding to cover the gap. In spite of recent up-moves, the stochastic index keeps receding coupled with a large distance between the %K line and the %D line. Adding to the signals indicating further downside, the parabolic sar band has just changed its direction and has crossed above the price action.
Trade suggestion
Sell Limit at 6880.00, Take profit at 6810.00, Stop loss at 6920.00
The British Pound dropped on Friday versus the U.S dollar, heading for a lower close for the fifth month in a row even after a chain of data released today came out with better-than-expected results. The Cable has been capped below the 1.30000 threshold as the greenback was boosted amid persistent risk-off trades, caused by the Deutsche bank crisis.
The U.K gross domestic product for the second quarter was revised upwards to 0.7%, from 0.6% in the revised GDP reading published on 26th August. The economy has grown at a positive rate for 14 quarters in a row since Quarter 1 (Jan to Mar) 2013. Commenting on the GDP data the Office for National Statistics stated that “There is very little anecdotal evidence at present to suggest that the referendum has had an impact on gross domestic product (GDP) in Quarter 2 2016”.
The positive revision to the second quarter GDP was due to the fact that the gains in services and investment outweighed losses in net exports. Business investment was 0.5% higher than previously estimated, while services grew 0.6%, instead of 0.5%. Net trade dented overall growth by 0.8% as exports fell 1% and imports gained 1.3%.
Also according to the ONS, the U.K. current-account deficit widened in the second quarter as Britain continued to record heavy outflows of investment income. The gap between money coming in and money going out of the U.K was 28.7 billion pounds ($37 billion), equating to 5.9% of GDP in the April-June period, up from 5.7% in the previous quarter.
Signs of an immediate shock to the economy in the wake of the Brexit vote in late-June have not emerged yet. Still, the British economy is expected to witness a sharp slowdown next year as Brexit saps foreign investment and in turn hits hiring. Consumer spending, the engine of growth in recent years, will be affected as a result.
In the U.S, consumer spending was little changed in August, data from the Commerce Department showed on Friday. Household purchases stood still for the first time since January, following a run of strong gains in previous months, as income grew at the slowest pace since February.
The Federal Reserve’s favorite inflation gauge picked up in August. The measure of inflation based on personal consumption expenditures rose 0.1% from the prior month, in line with expectations. On a yearly basis, the PCE index was up 1 percent.
The core prices measure, which strips out food and fuel, increased 0.2% from July and inched up 1.7 percent from August 2015, remaining under the Fed’s 2 percent goal since 2012.
The dollar still remained higher against other major currencies, up 0.34% at 95.75 compared to a basket of six major currencies, as investors have been flocking into safe-haven assets. Rattled by the Deutsche Bank’ selloff, European markets are trading lower and U.S stocks are also set to open lower.
Investors were still eyeing additional economic reports due later in the day including Consumer Sentiment and Inflation Expectations for September by University of Michigan.
Technical Analysis
GBPUSD has been locked between the support at 1.29000 and the resistance at 1.30600 for two weeks. The pair is under downward pressure of the two moving averages placed above the price action and the downtrend line connecting lower highs that has most recently forced the price to reverse lower yesterday.
Trade suggestion Sell Stop at 1.29500, Take profit at 1.29000, Stop loss at 1.30000
U.S stocks rebounded on Friday, wiping out weekly losses as the banking sector led gains. U.S.-listed shares of Deutsche Bank soared more than 13% in the last session of September, after Agence France-Presse reported that the Germany’s biggest lender is nearing a $5.4 billion settlement with the U.S. Department of Justice in its sub-prime lending related probe.
Earlier this month, the DOJ claimed $14 billion to settle an investigation tied to residential mortgage-backed securities. If the deal is reached, Deutsche Bank AG will save nearly two thirds of the penalty amount that was initially claimed by the DOJ.
Banks topped gainers today, with the banking sector up 1.45% in trading thus far. Among 11 sectors making up the SP500 index, only Real Estate and Utilities traded lower.
Trade suggestion Buy Stop at 2169.00, Stop loss at 2162.00, Take profit at 2180.00
Asian stocks climbed on Monday as risk sentiment was boosted by easing of concerns about Deutsche Bank AG’s finances after the lender had been reported to negotiate a much lower settlement with the U.S Department of Justice than the initial claim. MSCI's broadest index of Asia-Pacific shares outside Japan inched 0.8% percent higher following its best quarterly performance since early 2012.
Brexit angst continued to weigh on the British Pound. The Sterling created a wide gap down on the opening after British Prime Minister Theresa May said on Sunday that she would trigger the process of negotiating the UK's exit from the EU by the end of March. The pair GBPUSD hit the lowest since August 16 at $1.29162 in early Asian trading in thin liquidity.
The Bank of Japan released its tankan survey of business sentiment, early on Monday. The survey indicated that large Japanese manufacturer sentiment remained flat in the past three months while non-manufacturing business sentiment slipped to its lowest in nearly two years. The gauge for confidence among big manufacturers stood at plus 6 in September, unchanged from three months ago. The index missed a median market forecast of plus 7.
Sentiment among large companies in the service sector hit the lowest level since December 2014 at plus 18, falling for three straight quarters as a result of typhoons and a slowdown in spending by foreign tourists stemming from a strong yen.
However, Japanese firms' appetite for capital spending remained resilient. Big firms plan to raise capital spending by 6.3 percent for this fiscal year, from year-before levels, basing their business plans on the assumption that the dollar would average 107.92 yen for the fiscal year through March 2017, down from 111.41 yen forecast three months ago.
Markets in China, Australia, Germany, Malaysia and South Korea are shut due to local holidays on Monday.
Technicals
USDJPY
Fig: USDJPY H4 Technical Chart
USDJPY has been moving in a thin range since it breached the resistance at 101.200 as the pair is facing strong resistance from the descending trendline connecting lower highs since the start of September. The long upper shadow of recent candles indicates attempts by buyers to push the price higher but sellers have jumped in every time and snapped any rally. With the %K line having crossed over the %D line from above, the pair may fall back below the 101.200 level.
Trade suggestion
Sell Stop at 101.150, take profit at 100.850, stop loss at 101.450
NZDUSD
Fig: NZDUSD H4 Technical Chart
NZDUSD has been moving sideways to lower since a steep slide on September 22. The pair is moving in the range between the support at 0.72200 and the resistance at 0.72900. As can be seen on the chart, lower lows and lower highs are being formed, indicating strengthening bears. Stochastic lines pointing down are consolidating the downtrend. The price action has broken below both the MA's which are now placed above the price action and adding further downside momentum.
Trade suggestion
Sell Stop at 0.72500, take profit at 0.72200, stop loss at 0.72900
CADJPY
Fig: CADJPY H4 Technical Chart
CADJPY has been on a rise since it rebounded from over four-year lows at 75.384. The two moving averages which acted as resistance through most of September have turned into dynamic supports that supported prices to reverse higher last Friday. The short-term MA20 has converged with the long-term MA50 from below, suggesting further up moves.
Trade suggestion
Buy Stop at 77.350, take profit at 77.825, stop loss at 77.000
GOLD
Fig: GOLD H4 Technical Chart
Gold has been trading sideways under the 23.6% retracement level at 1319.40 since it broke below this level on Friday. The yellow metal failed to surge above this handle in early Asian trading hours and had to retreat and head down towards the multi-month lows at 1302.00 recorded at the start of September. With the two MAs placed above the price action and RSI remaining below 50, Gold is expected to fall deeper.
Trade suggestion
Sell Stop at 1314.00, take profit at 1308.90, stop loss at 1320.00
WTI
Fig: WTI H4 Technical Chart
U.S crude prices seemed to resume the uptrend after a brief correction from one-month highs at 48.30. The wide gap between the short-term and long-term moving averages is widening, suggesting a strong uptrend, which has pushed the market to near the overbought zone. In the event of a continual up-move, the commodity is expected to pull back after hitting the resistance at 48.30.
Trade suggestion
Sell Limit at 48.30, take profit at 47.75, stop loss at 48.60
EURO50
Fig: EURO 50 H4 Technical Chart
Euro Stoxx 50 index opened the session with a small gap down after a strong rally on Friday. Since early September, lower lows have been created, suggesting a weakening of the bulls in the market. While the stochastic chart has neared the overbought zone, the RSI is still lingering around average level. The 38.2% level is within sights but this is not a firm support level considering recent price cycles. Traders may need to wait for more signals to enter a trade.
Trade suggestion
Buy Stop at 3016.50, take profit at 3060.00, stop loss at 3084.40
EURUSD Stuck In Thin Range After Friday’s Sharp Surge – Buyers Can Enter
The Euro has been trading sideways to higher in a thin range in early European trading hours on Monday. The pair surged nearly 1% on Friday in the wake of positive signs with regards to inflation growth, and Deutsche Bank’s settlement with the U.S DOJ in a case tied to its sale of mortgage-backed securities before the sub-prime financial crisis.
In a report published last Friday, Eurostat said consumer price inflation (CPI) in the euro zone ticked up by 0.4% in September, in line with forecasts and up from the final reading of a 0.2% advance in August.
Low crude prices continued to drag down inflation. Core CPI, which excludes food, energy, alcohol, and tobacco costs, rose by a seasonally adjusted 0.8% last month, unchanged compared to the previous month’s 0.8% increase but missing expectations for a 0.9% gain.
Europe’s headline CPI has been surging month after month since February but the core reading has remained under 1% for 6 months, which is far below the European central bank’s target of 2%. The ECB is scheduled to hold its next monetary policy meeting on October 20th. In its last meeting in September, the Bank decided to leave its rates and asset-buying program unchanged with no explicit guidance on future moves being indicated or published. Therefore, no changes are expected in the upcoming meeting.
Besides inflation readings, Deutsche Bank’s case has also clouded the EURUSD markets. Markets are still waiting for more news on the German lender after news agency Agence France-Presse reported that Deutsche was nearing a $5.4 billion settlement with the DOJ, well below the originally demanded amount.
The strong bullish momentum from Friday seems to be waning today, resulting in little change in the pair even after a series of EU manufacturing activity data readings were relased earlier today. Markit’s Manufacturing PMI for the euro zone, released earlier today, picked up to 52.6 last month. The survey showed that increasing demand from both within and outside the 28-member bloc boosted factory activity which prompted managers to accelerate hiring.
All sub-indexes namely output, new orders, new export business and employment improved, the report said. Among them, new orders jumped to 53.4 – the highest reading in the past year.
However, the upturn remained uneven among Eurozone’s members. While Germany, Austria and Netherlands recorded the highest growth rates, Spain, Italy and Ireland registered a slower pace of growth. Manufacturing in France and Greece continued to decline.
In the U.S, the Institute of Supply Management is scheduled to report on September manufacturing activity early U.S session today. The result is expected to swing back into expansion territory after unexpectedly falling below 50 in August.
Technical Analysis
EURUSD has been trading sideways in a 20-pip range above the support at 1.12200. The market is generally awash with positive and upbeat sentiment. The RSI index remains above 50. The short-term MA20 is likely to converge with the long-term MA50 from below suggesting further up moves. The price action has broken through both the MA’s from below and is comfortably placed above both MA’s.
Trade suggestion Buy Stop at 1.12435, Stop loss at 1.12200, Take profit at 1.12700
Tesla Reports Best Ever Quarterly Sales – Strong Future Guidance Makes Shares A Strong Buy
Shares of Tesla Motor Inc. soared strongly in the US morning session after the electric-car maker reported that its quarterly sales hit a record during the July through September period. The California-based company said 15,800 Model S sedans and 8,700 Model X sports-utility vehicles were delivered in the third quarter of 2016. Another 5,500 vehicles which were in transit to customers will be counted in fourth quarter results.
The auto-maker on Sunday reiterated strong guidance for the fourth quarter, and stated that sales and production during the fourth quarter shall be at levels similar to, or slightly better than the third quarter. In three months through September, Tesla produced 25,185 vehicles, which marked a 37% gain from the second quarter.
Tesla had previously stated that it expected to produce 50,000 vehicles in the second half of this year after missing projections by 30,000 vehicles during the first six months of the year.
Trade suggestion Buy Stop at 213.00, Take profit at 215.60, Stop loss at 208.00
The U.S dollar continued to strengthen against most of its peers, extending gains after the Institute for Supply Management (ISM) said on Monday that the purchasing managers index for the manufacturing sector rose to 51.5 in September from 49.4 the prior month. The gauge assesses confidence among mangers regarding manufacturing sector activity. The reading pointed to an expansion last month after shrinking in August.
In an interview on Bloomberg Television on Monday, Federal Reserve Bank of Cleveland President Loretta Mester stated that the case for a rate hike this year remained compelling and she expected that the target range for the benchmark federal funds rate would be raised as soon as November. Markets are not pricing too much of a change next month as the meeting is too close to the U.S. presidential elections.
Besides Fed Cleveland President Mester, New York Fed President William Dudley also spoke on Monday. Speaking at a private conference at the New York Fed, President Dudley expressed fears that the Fed would not have as much policy room as it did during the period of financial crisis to support the economy if the U.S fell into recession in the next few years. Hence, the central bank should be cautious about raising interest rates.
Australia’s central bank, led by new Governor Philip Lowe, kept the benchmark rate unchanged at a record-low of 1.5 percent at its monetary policy meeting earlier today. The bank cited an unexpected rebound in commodity prices as a boost to the economy, helping it to grow at an above-average pace. Additionally, the housing boom in Australia is an area of rising concern and the real estate sector is in a situation that may not be suitable for further cuts, especially when the unemployment rate is falling and international trading conditions are favourable for Australia.
Technicals
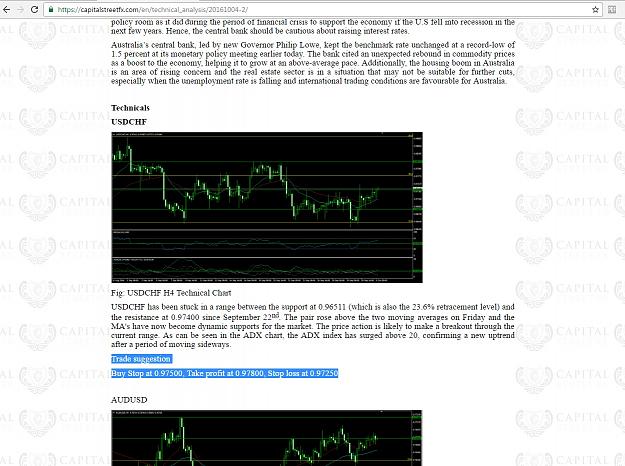
USDCHF
Fig: USDCHF H4 Technical Chart
USDCHF has been stuck in a range between the support at 0.96511 (which is also the 23.6% retracement level) and the resistance at 0.97400 since September 22nd. The pair rose above the two moving averages on Friday and the MA's have now become dynamic supports for the market. The price action is likely to make a breakout through the current range. As can be seen in the ADX chart, the ADX index has surged above 20, confirming a new uptrend after a period of moving sideways.
Trade suggestion
Buy Stop at 0.97500, Take profit at 0.97800, Stop loss at 0.97250
AUDUSD
Fig: AUDUSD H4 Technical Chart
AUDUSD is struggling around the 0.76730 level but is generally receiving support from the short-term MA20. The Aussie is expected to soar higher as the relative strength index continues to stay above the 50-line which separates the bullish territory from the bearish territory. Both MA's are currently placed below the price action and underpinning the market currently. The pair may test the high from Thursday at 0.77095.
Trade suggestion
Buy Stop at 0.76800, Take profit at 0.77095, Stop loss at 0.76600
EURCAD
Fig: EURCAD H4 Technical Chart
EURCAD has been moving sideways to lower since the start of the new month. The pair is currently under downward pressure from the two MAs which are placed above the price action and the downward sloping trendline that connects lower highs since September 27th. Both the MA's are currently placed above the price action.With the RSI indicating bearish sentiment, the pair is anticipated to fall further to the 23.6% level.
Trade suggestion
Sell Stop at 1.46900, Take profit at 1.46350, Stop loss at 1.47470
SILVER
Fig: SILVER H4 Technical Chart
Silver was moving sideways under the long-term MA50 in the first half of yesterday’s trading day and eventually failed to breach this resistance. Furthermore, silver fell out of the recent range between 19.265 and 18.960 to hit major support at 18.765. This is a major support zone that had contained the prices in mid-September. As the market has entered the oversold zone, buyers stepped in and pushed the price back up, which can be seen in long lower shadow in recent candles. Silver may have found a bottom and is likely to pull back.
Trade suggestion
Buy Stop at 18.960, Take profit at 19.265, Stop loss at 18.765
COPPER
Fig: COPPER H4 Technical Chart
Copper has broken below the two MA's which have now turned into new points of resistance after the price action crossed over from above yesterday. A sharp decline on Monday sent the market into the bearish zone, trimming the rally that reigned in the second half of September. The commodity may fall deeper with the support at 2.1640 within sight. A weak reading on the RSI is confirming the downward momentum.
Trade suggestion
Sell Stop at 2.1850, Take profit at 2.1640, Stop loss at 2.2050
Dow Jones
Fig: Dow Jones H4 Technical Chart
The Dow has been trading in a shrinking range for a month now, which has caused the RSI index to swing back and forth around the average line. The pair failed at the upper boundary of the recent range yesterday and fell back. The market may attempt a test of the lower boundary today, in case the retreat from yesterday continues. The %K line and %D line are heading downwards, suggesting a continuation of the downtrend.
Trade suggestion
Sell Stop at 18.220, Take profit at 18.100, Stop loss at 18.300
Warmer Autumn Weather Cools Off Natural Gas – Selling Suggested
Natural gas prices have been trading sideways to lower since late September as stocks have continued to build slowly due to cooler Autumn weather, that has reduced demand for air conditioning, thereby reducing power consumption.
The weekly report from the U.S. Energy Information Administration on Thursday reported that inventories held in storage in the U.S. rose less than expected during the week ended September 23rd. The EIA said stockpiles rose by 49 billion cubic feet last week, to 3.6 trillion cubic feet, up 90 billion cubic feet from a year ago and 220 billion cubic feet above the five-year average.
Lower gas prices have discouraged drilling activity and caused production to start falling, while consumption has been hitting record levels. All these factors combined have boosted natural gas higher to reach the highest levels since January 2015. Gas demand for electricity generation has been consistently rising, as cheap gas and climate policy have encouraged power producers to replace old and inefficient coal-fired power plants with more efficient and cleaner gas-fired power plants.
Changing weather conditions have also played a part in altering the supply-demand dynamic. According to official data, temperatures across the most populated areas of the United States have been consistently above normal since the end of May, which has spurred higher than usual demand for air-conditioning usage this summer and caused prices to rise.
The summer demand has now neared an end and autumn is the time when traders usually bet on the strength of the heating market. As a result, warmer-than-average temperatures are likely to lower the heating demand usually witnessed at this time of the year. Monday’s weather updates have reported above-normal temperatures settling in across nearly the entire U.S for the next two weeks. With temperatures expected to be moderately above seasonal norms, it is understandable that traders have been on the sidelines and let prices trade sideways.
In the long run, the drilling downturn has shrunk the earlier supply surplus. Small weekly additions to gas stockpiles have caused the surplus over last year’s levels to decline to just 2.6% more than the stockpiles last year, and the surplus compared to the five-year average to drop to just 6.5% above the 5-year average, as on Sept. 23. All data is based on the U.S. Energy Information Administration report from Thursday.
Meanwhile, the winter of 2016/17 is forecast to be colder than the record warm winter of 2015/16, ensuring higher gas consumption for heating. With more gas-fired power plants scheduled to start up over the next 12 months, natural gas prices are expected to continue rising in the last quarter of 2016.
Technical Analysis
Natural Gas is trapped in a trading range between 2.875 and 2.935 after falling as much as 8.9% from the high at 3.165. Both the short-term and long-term MAs are placed above the price action and casting downward pressure on prices. The market may fall further towards the support zone at the 23.6% retracement level at 2.797 as the market currently remains gripped by bearish sentiment.
Trade suggestion Sell Stop at 2.875, Stop loss at 2.935, Take profit at 2.797